

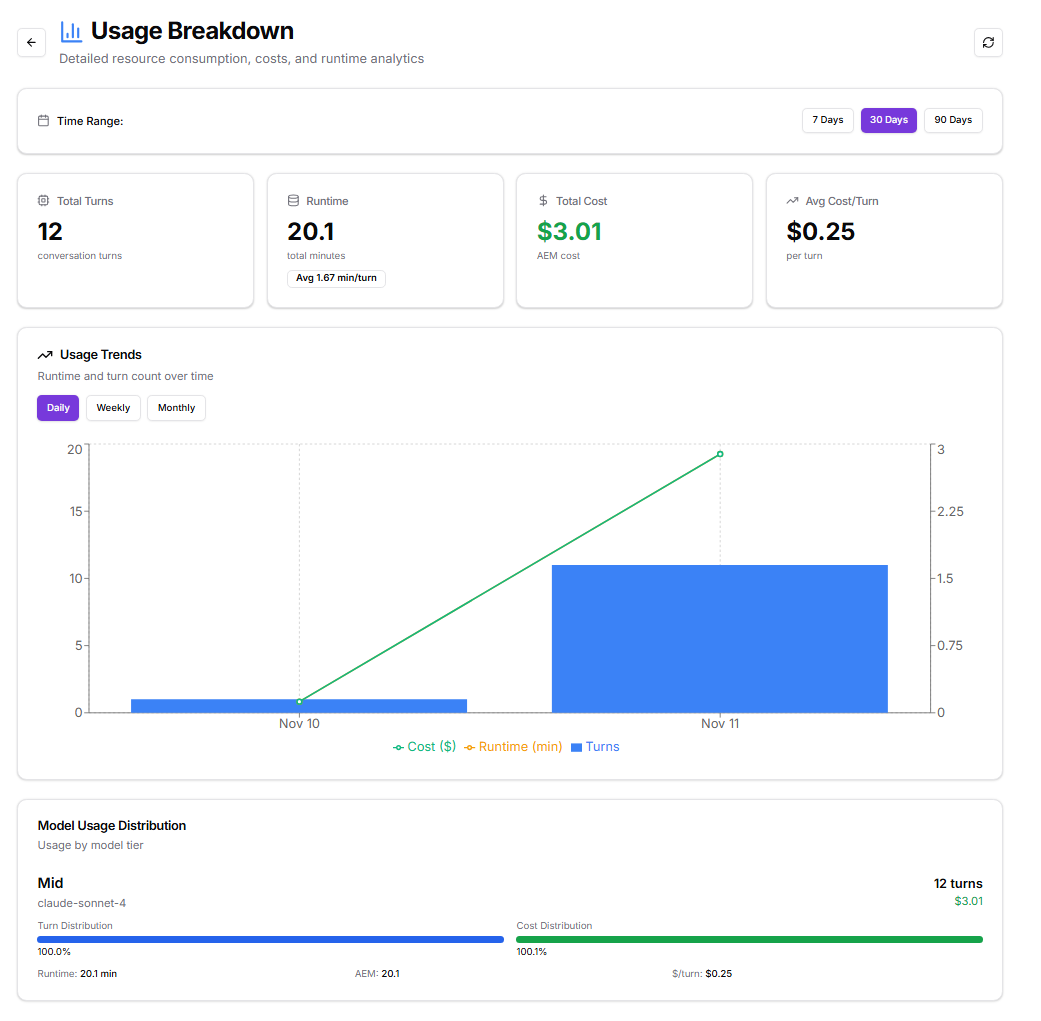
Key Metrics
1. Total Turns: Represents the total number of conversation or execution turns completed within the selected time period.- Value: 12 turns
- Each turn corresponds to one complete interaction or execution cycle within a task or workflow.
- Value: 20.1 total minutes
- Average: 1.67 minutes per turn This metric reflects the actual operational time agents spent processing workloads.
- Value: $3.01 total
- Calculated using the AEM pricing rate of $0.15 per AEM minute. This value helps quantify the financial footprint of agent operations.
- Value: $0.25 per turn Useful for assessing cost efficiency and projecting future workload expenses.
Usage Trends
The Usage Trends graph visualizes the correlation between runtime, total turns, and cost over time. It allows users to identify growth patterns, peaks in usage, or consistent consumption behaviors.- Runtime (min): Tracks how long agents are running per day or week, revealing efficiency and throughput.
- Turns: Reflects activity volume and engagement frequency across agents.
- Cost ($): Maps operational expenses proportionally to runtime and turns.
Model Usage Distribution
The Model Usage Distribution section breaks down consumption by model capability tier, helping teams understand which model types dominate workloads and costs. In this case:- Model Tier: Mid (Claude Sonnet 4)
- Turn Distribution: 100%
- Cost Distribution: 100%
- Runtime: 20.1 minutes
- AEM Consumption: 20.1 AEM
- Cost Efficiency: $0.25 per turn
Interpretation and Optimization
The Usage Breakdown data provides a practical basis for optimizing both runtime and cost efficiency:- Monitor per-turn runtime: High per-turn averages may indicate complex or inefficient workflows; breaking them into smaller, modular processes can improve throughput.
- Review cost patterns: Align frequent or simple operations with lower-weight models (e.g., Haiku) to reduce AEM costs.
- Balance task load across tiers: Distributing workloads by complexity ensures optimal utilization of model tiers while keeping expenses predictable.
- Track usage trends: Regularly reviewing trend data helps anticipate spikes in operational demand and manage budgets proactively.