

Formula
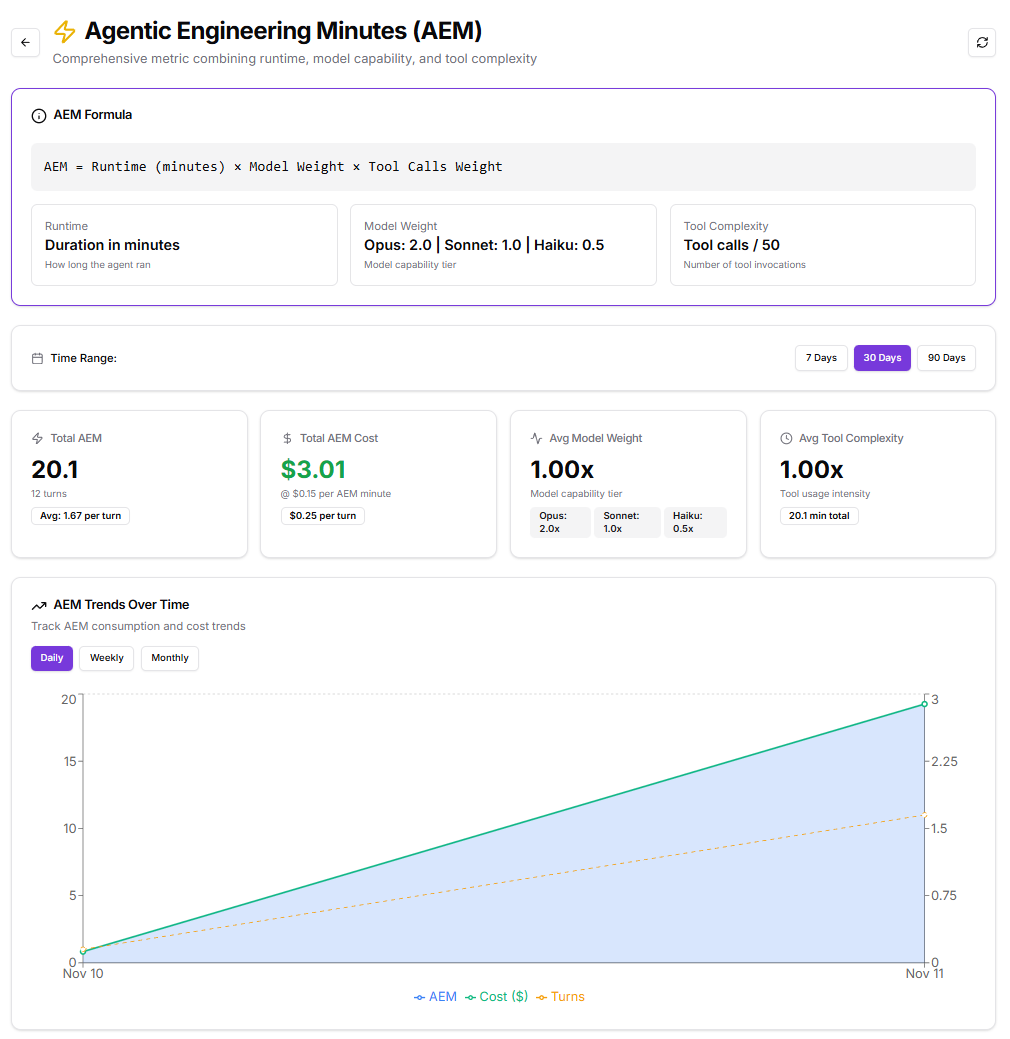
AEM = Runtime (minutes) × Model Weight × Tool Calls Weight- Runtime: Represents the total execution time in minutes for an agent or workflow. Longer runtimes typically correspond to more complex or data-intensive operations.
-
Model Weight: Reflects the computational tier of the model used.
- Opus: 2.0×, suitable for critical reasoning and high-complexity tasks.
- Sonnet: 1.0×, provides balanced performance for standard workloads.
- Haiku: 0.5×, optimized for lightweight or high-frequency operations.
- Tool Complexity: Indicates the relative intensity of tool usage. It is derived from the number of tool calls made (normalized to 50 calls). Higher complexity leads to increased AEM consumption.
Key Metrics
Over the recent analysis period:-
Total AEM: 20.1 minutes across 12 agent turns.
- Average per turn: 1.67 minutes.
- Total AEM Cost: 0.15 per AEM minute or approximately $0.25 per turn.
- Average Model Weight: 1.00×, reflecting consistent use of mid-tier (Sonnet) capability.
- Average Tool Complexity: 1.00×, indicating moderate tool usage across operations.
Trend Analysis
AEM Trends Over Time This view tracks consumption and cost growth over daily, weekly, or monthly intervals. It helps identify whether performance or cost increases are linked to longer runtimes, heavier models, or increased tool usage. Recent data shows a proportional rise in both AEM and cost, suggesting stable efficiency ratios, performance and expenditure are scaling evenly. AEM Weight Factors Trends in model weight and tool complexity are monitored together to identify shifts in workload type. For this period, both factors remained constant at approximately 1.0×, confirming steady task composition without significant variation in tool or model demands.Weight and Tier Breakdown
AEM by Model Tier All activity for this interval was within the Mid-Tier capability band (Sonnet), accounting for 100% of AEM consumption.- 20.1 total AEM minutes
- $3.01 cost
- 12 turns executed
Cost Optimization Insights
Several optimization strategies can help maintain or reduce AEM consumption while preserving operational quality:- Use Sonnet for balanced workloads Sonnet (1.0× weight) offers the best equilibrium between capability and cost for most routine or analytical tasks.
- Reserve Opus for critical reasoning Opus (2.0× weight) should be limited to complex reasoning, extensive code analysis, or multi-layered inference workflows to control AEM growth.
- Optimize tool usage Reducing unnecessary or redundant tool invocations lowers the Tool Calls Weight component, directly decreasing total AEM.
- Deploy Haiku for high-frequency simple tasks Haiku (0.5× weight) delivers significant cost savings for repetitive or lightweight operations, making it ideal for scale scenarios.