

Key Functional Sections
Summary Cards
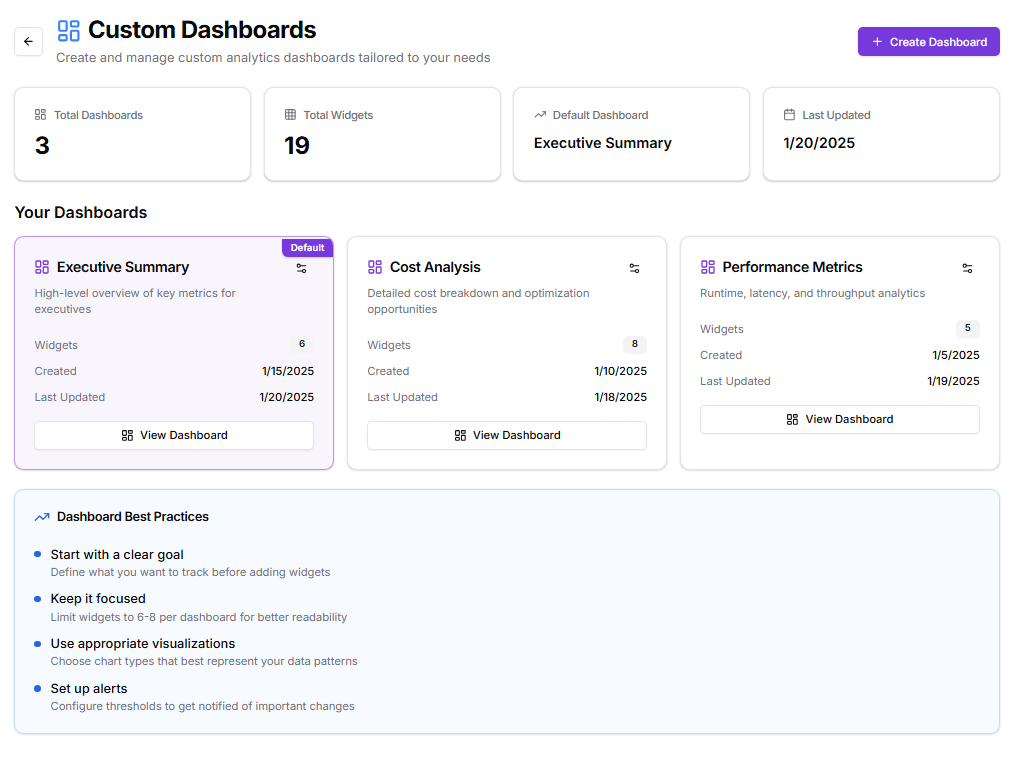
Four summary cards provide an at-a-glance view of overall dashboard statistics:- Total Dashboards – Displays the total number of dashboards currently created.
- Total Widgets – Shows the cumulative count of all widgets across dashboards.
- Default Dashboard – Indicates which dashboard is currently set as the default.
- Last Updated – Shows the most recent modification date among all dashboards.
Dashboard List
Below the summary cards, the Your Dashboards section displays individual dashboard cards. Each card contains:- Dashboard name and a short description.
- Number of widgets within the dashboard.
- Creation and last updated dates.
- A View Dashboard button for direct navigation.
- The Default badge, where applicable, to mark the primary dashboard.
- Executive Summary – A high-level overview of key metrics relevant to executives.
- Widgets: 6
- Created: 1/15/2025
- Last Updated: 1/20/2025
- Cost Analysis – Provides a detailed breakdown of costs and identifies optimization opportunities.
- Widgets: 8
- Created: 1/10/2025
- Last Updated: 1/18/2025
- Performance Metrics – Tracks runtime, latency, and throughput analytics for operational performance.
- Widgets: 5
- Created: 1/5/2025
- Last Updated: 1/19/2025
Dashboard Best Practices
A guidance panel titled Dashboard Best Practices is included at the bottom of the page. It offers practical tips to help users design efficient and meaningful dashboards:- Start with a clear goal – Define what data or KPIs you intend to monitor before adding widgets.
- Keep it focused – Maintain clarity by limiting each dashboard to six to eight widgets for better readability.
- Use appropriate visualizations – Choose chart or widget types that best represent the underlying data trends.
- Set up alerts – Configure thresholds to receive notifications for significant changes or anomalies.