

Prerequisites
The Context Graph reflects the data Kubiya has ingested. To populate the graph meaningfully:- At least one integration, uploaded data source, or custom connector must be configured
- The ingestion pipeline needs to successfully retrieve and normalize data
- The graph must have processed data into nodes, labels, and relationships
Graph Summary Metrics
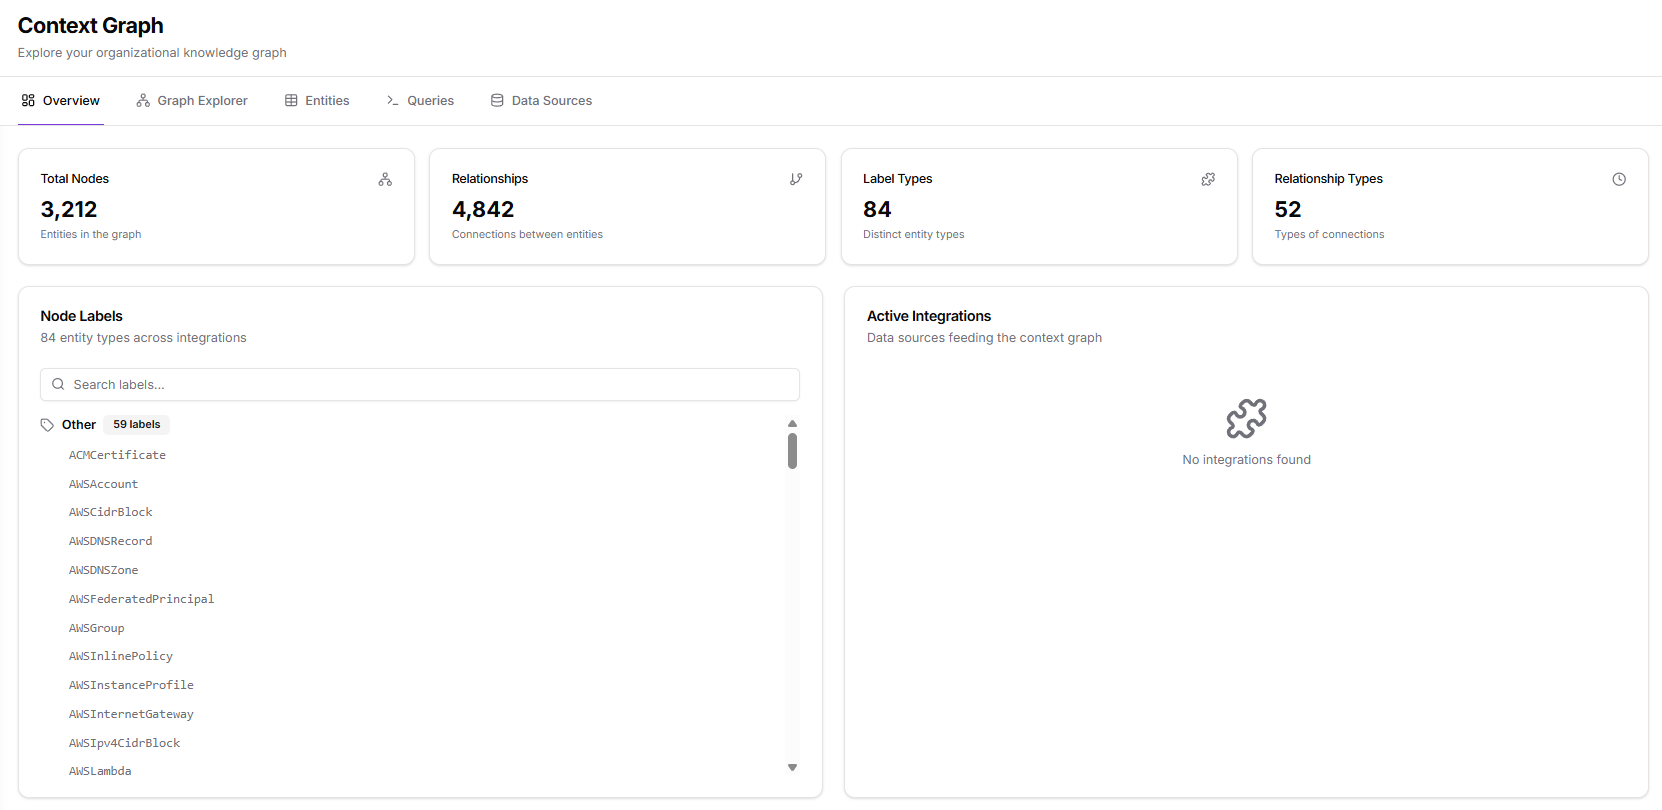
The summary cards at the top of the page indicate the overall size and structural richness of the organizational graph. Each metric updates automatically as data sources ingest new entities.Total Nodes
The number of individual entities indexed in the graph. Nodes represent every object Kubiya has ingested, such as cloud resources, accounts, identities, storage objects, DNS records, custom integration items, and any other supported data types. A higher count indicates broader ingestion coverage across connected data sources.Relationships
The number of connections that link entities to one another. Relationships capture how objects interact or depend on each other, such as a role attached to a policy, an instance belonging to a subnet, or a repository containing images. This metric reflects how much structure exists within your ingested data and how interconnected your systems are.Label Types
The number of distinct entity types present in the graph. Each label represents a unique classification of a node (e.g., IAM roles, EC2 instances, DNS records, Kubernetes objects, or custom-defined types). A diverse set of labels means the graph spans multiple functional domains and integration categories.Relationship Types
The number of different categories of relationships between entities. Relationship types describe how nodes relate, for example, attachment, membership, containment, association, inheritance, and many others depending on the ingested systems. More relationship types indicate richer, more expressive modeling of your environment.Node Labels
The Node Labels panel lists all entity labels detected across the graph. This section helps users understand the full taxonomy of object types available for exploration and querying. Key capabilities include:- Searchable label list: quickly locate a specific entity type
- Category grouping: labels are organized into logical groups
- Expandable lists: open any category to browse all labels it contains
- Accurate reflection of ingested data: only labels that exist in the graph are shown
Active Integrations
The Active Integrations card displays the data sources currently feeding information into the Context Graph. Only integrations that actively contribute entities or relationships appear here. This helps users:- Confirm which data sources are populating the graph
- Understand the origin of entity types and relationships
- Validate that expected systems are connected and ingesting successfully
How the Overview Page Helps
The Overview page is designed to provide quick situational awareness before users dive into deeper analysis. It is commonly used to:- Verify that the Context Graph is populated and ready for exploration
- Assess the breadth (label types) and depth (relationship types) of ingested data
- Understand the scale and structure of the graph
- Determine which types of entities exist before writing queries
- Confirm whether ingestion pipelines and integrations are operating as expected
- Graph Explorer: visual relationship mapping
- Entities: tabular inspection and detailed metadata
- Queries: freeform Cypher query execution
- Data Sources: integration and ingestion configuration
What’s Next
- Meta Agent Explore your infrastructure through natural language conversation. Ask questions, get insights, and discover relationships without writing queries.
- Graph Visualization Visually inspect the graph, traverse nodes, filter by type or data source, and examine detailed relationships.
- Entities Browse every entity in the graph in a tabular format, inspect properties, and navigate to node-level details.
- Queries Run Cypher queries for advanced programmatic analysis and SDK/API integration.
- Data Ingestion View and manage the ingestion sources that feed the graph.