

Prerequisites
To see meaningful content in the Entities page:- At least one data source or integration must have ingested entities
- Entity types (labels) must be available in the graph
- Ingestion must have completed successfully so that entity metadata is populated
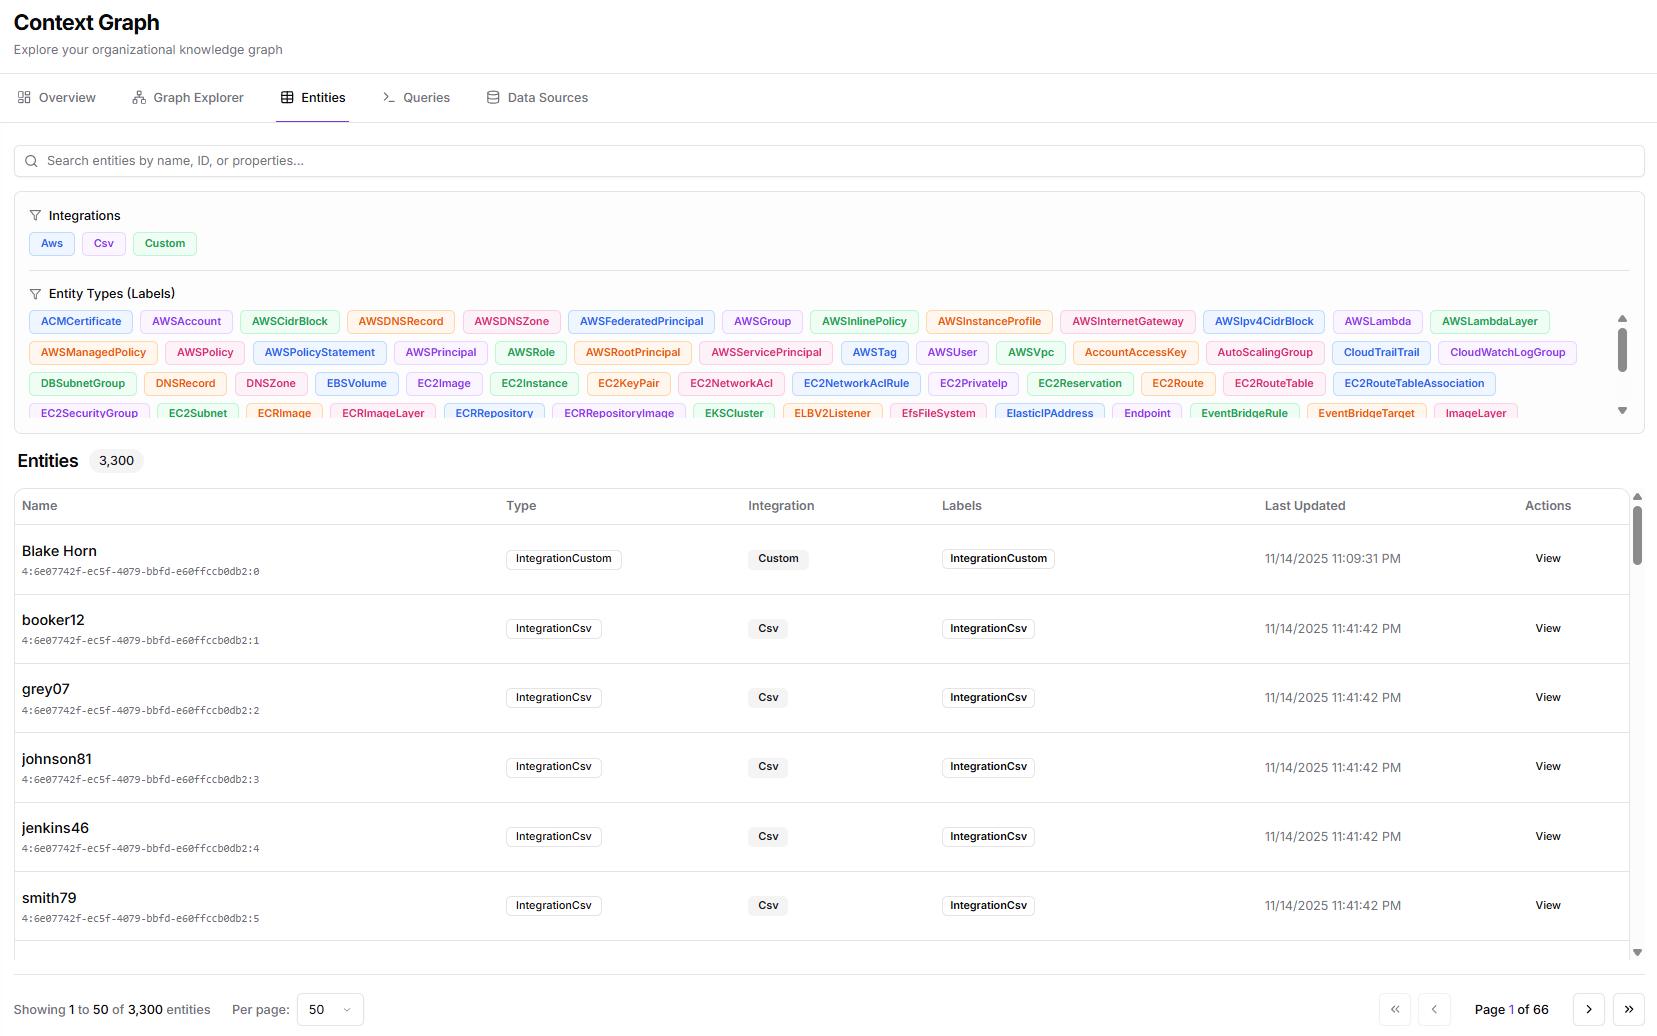
Page Layout and Components
The Entities page includes:- Search bar: free-text filtering across names and properties
- Filters: integrations and entity types
- Entities table: tabular list with details and actions
- Pagination: navigate through large datasets
- Entity Details Panel: full detail view when selecting “View”
Global Search
At the top of the page, the search bar “Search entities by name, ID, or properties…” allows filtering across all fields indexed for each entity. You can search using:- Partial names
- Unique IDs
- Cloud resource identifiers
- Integration-specific properties
- Custom ingestion fields
Filters
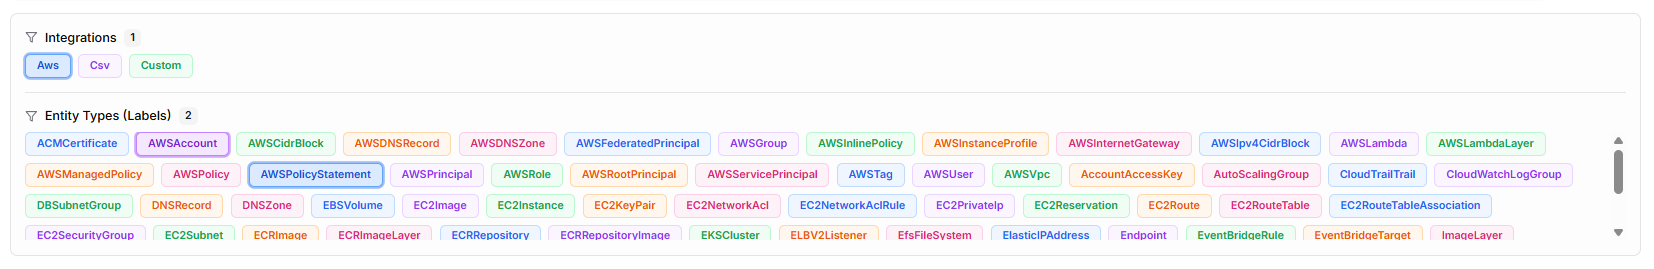
Integration Filters
This filter shows all integrations contributing data to the graph, such as:- AWS
- CSV
- Custom
Entity Type (Label) Filters
Below integrations is a full list of label types present in the graph. Each label corresponds to an entity type (for example: accounts, IAM objects, network components, storage resources, custom ingested items, and more). Selecting one or more labels filters the table to show only entities of those types. Because the label list can be long, it is:- Scrollable
- Color-coded
- Fully selectable
- Clearly grouped under “Entity Types (Labels)”
Entities Table
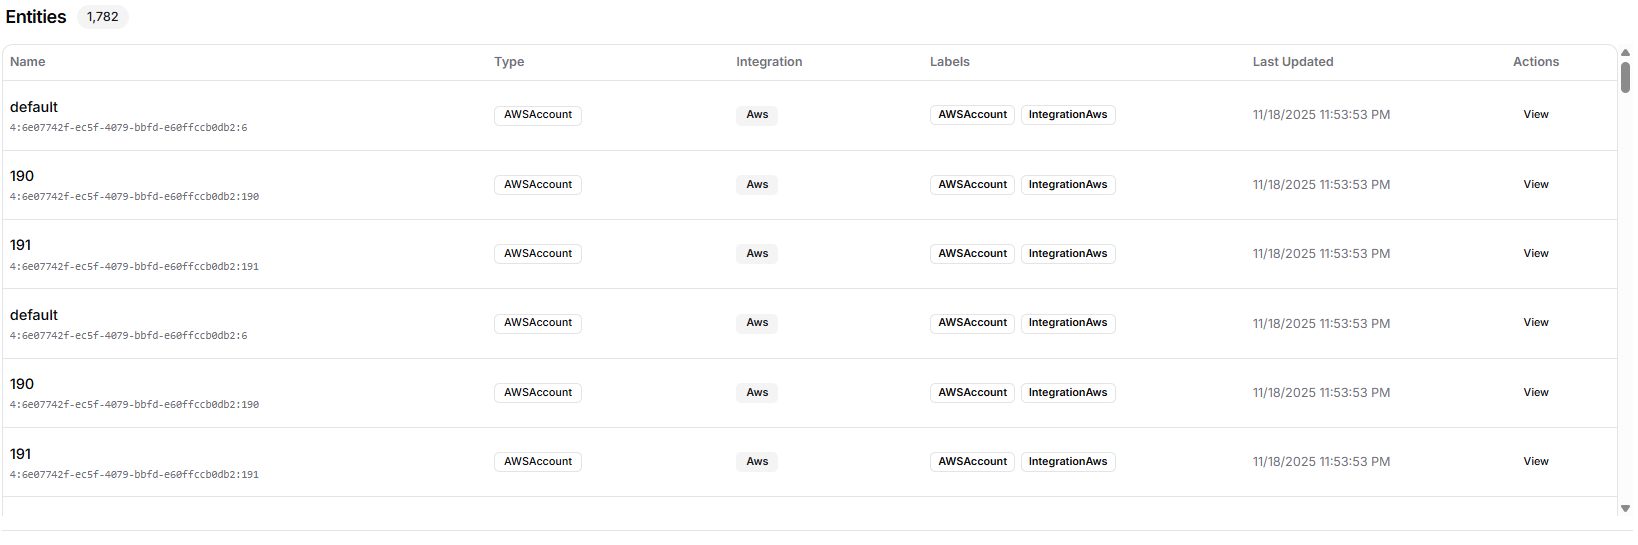
Name
The entity’s primary display name. This may be a human-readable identifier, a username, a resource name, or any unique label derived from ingestion. Beneath the name, the entity’s internal graph ID is shown.Type
The type of the entity as interpreted by Kubiya. This corresponds to the specific label applied: such asAWSPrincipal, EC2Instance, DNSRecord, CustomObject, or any other supported type.
Integration
Shows which integration the entity originated from. This helps differentiate between cloud data, CSV uploads, or custom ingestion streams.Labels
The full set of labels attached to the entity. Entities often have multiple labels that describe their type, classification, or integration metadata. These labels match what appears in Graph Explorer and are consistent across the entire Context Graph.Last Updated
Timestamp showing the last time the entity was refreshed by ingestion. This helps verify recency and detect outdated or stale data.Actions (View)
Clicking View opens the full detail panel for the selected entity on the right side of the page.Entity Details Panel
Selecting View brings up a detailed panel, mirroring what appears when clicking a node in Graph Explorer but with more context and complete information.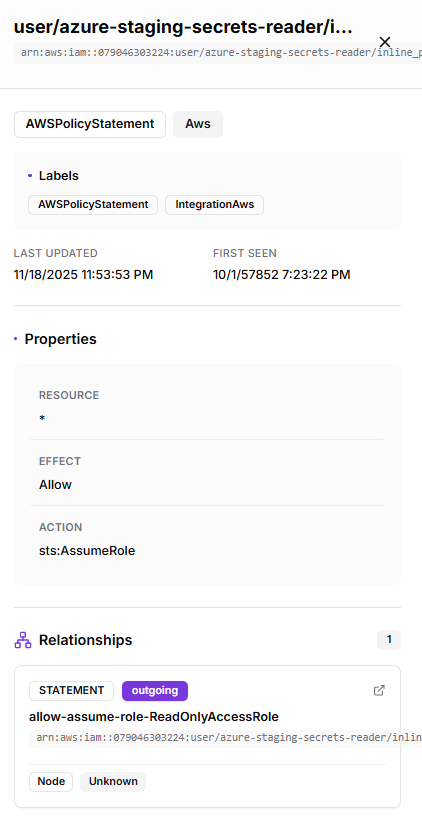
Labels
All labels applied to the entity, such as identity, policy, resource, or integration-specific categories.Metadata
Includes:- Last Updated
- First Seen
- Node ID
Properties
A structured list of all properties ingested for the entity. Depending on the type, properties may include:- Name
- Path
- Created Date
- ARN
- UserId
- Internal fields from AWS, CSV, or custom sources
Relationships
Every relationship connected to the entity is shown here, grouped and labeled clearly. For each relationship, the panel displays:- Relationship type (e.g., RESOURCE, POLICY, AWS_ACCESS_KEY)
- Direction (incoming or outgoing)
- Target node name
- Target node type
- IAM principals linked to policies
- Roles associated with access keys
- Resources connected to accounts
- Custom entities linked via ingestion relationships
Pagination
At the bottom of the table:- Users can choose how many entities to display per page (e.g., 50)
- Navigation arrows allow moving between pages
- Total entity count is displayed clearly (e.g., “3,300 entities”)
How the Entities Page Helps
The Entities page is used to:- Inspect specific resources, identities, or objects in detail
- Validate ingestion outputs from each data source
- See exact metadata and timestamps for each entity
- Review relationship connections to understand graph topology
- Debug unexpected or missing resources
- Locate entities before writing Cypher queries
- Navigate to deeper investigation using the entity detail panel
What’s Next
Once you’ve explored entities in the table, the following pages allow deeper analysis:- Queries Write and execute Cypher queries to filter, join, and analyze graph data programmatically.
- Data Sources View all integrated systems, ingestion counts, and connect new sources to expand the graph.