> ## Documentation Index
> Fetch the complete documentation index at: https://docs.kubiya.ai/llms.txt
> Use this file to discover all available pages before exploring further.
# Graph Explorer
> Visual graph exploration and relationship discovery
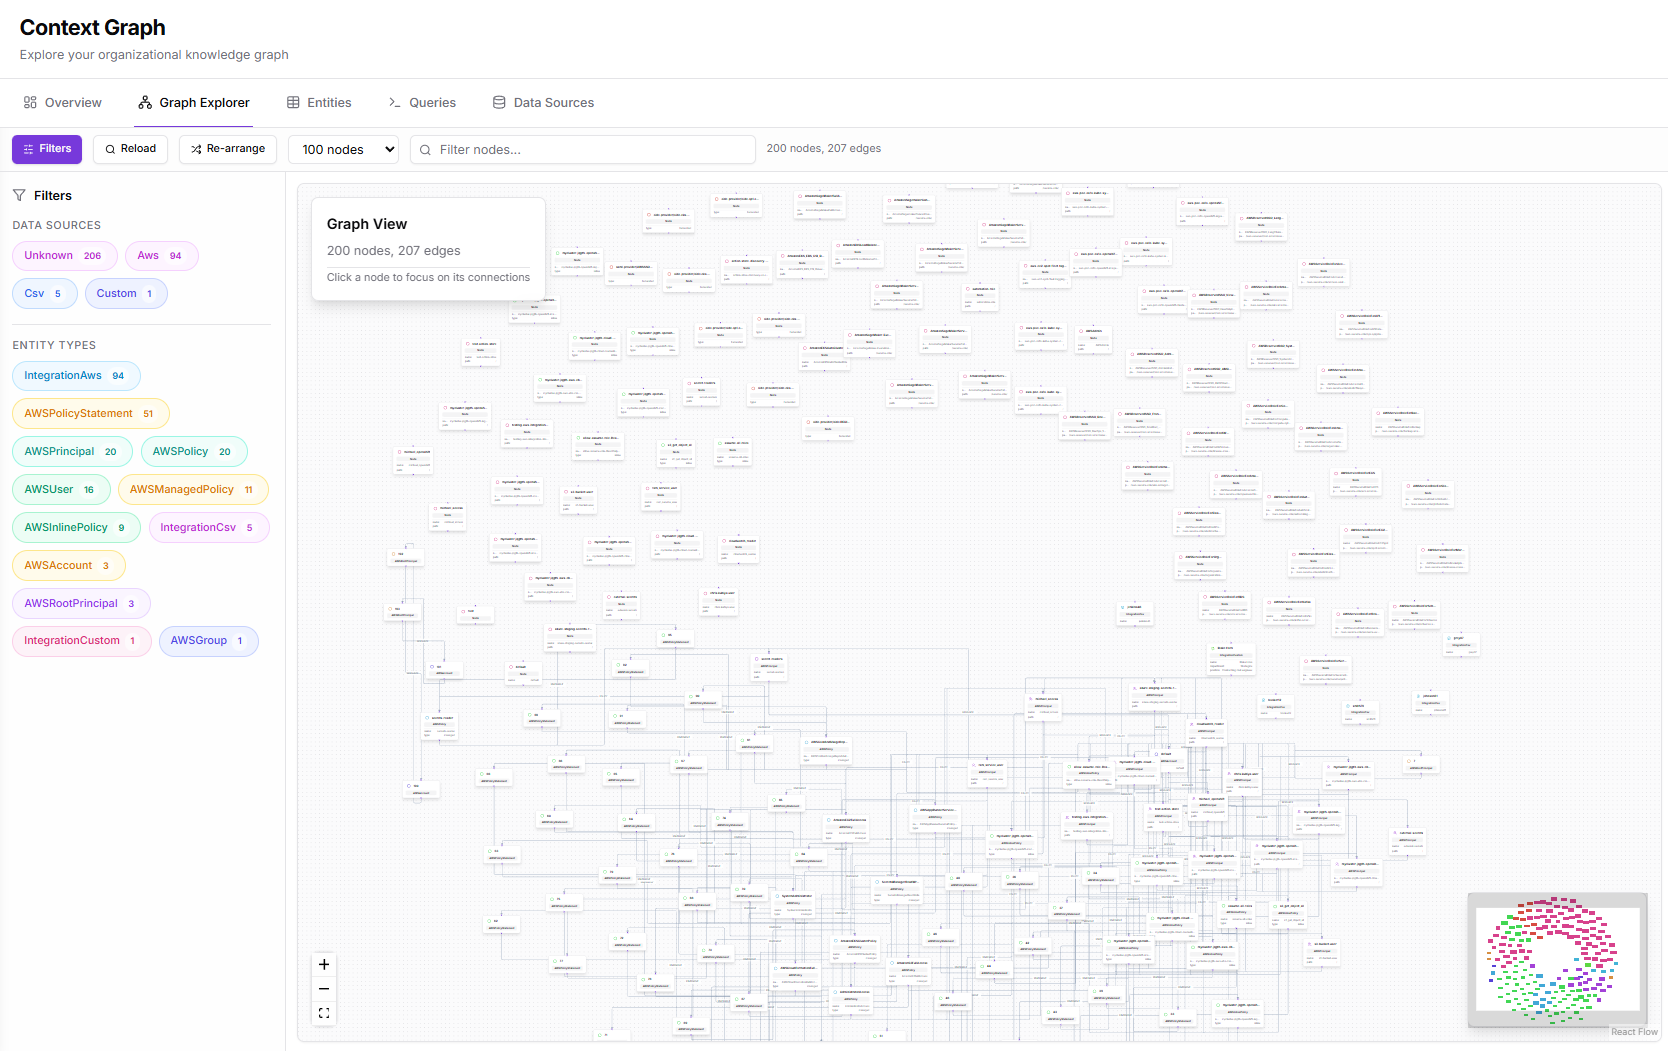
The Graph Explorer provides an interactive visualization of your Context Graph, allowing you to explore relationships between entities visually.
 ## Access
Click **Context Graph** > **Explorer** in the sidebar.
## Interface Layout
### Left Panel: Graph Filters
Filter the visible nodes and edges:
**Data Sources:**
Filter by where entities originated:
* Unknown
* Git
* User
* Test
* Memory
* Verification
* Module
* And more based on your connected sources
Each source shows the count of entities from that source.
**Entity Types:**
Filter by entity type:
* GITHUB\_KUBIYA
* GITHUB\_SEC\_F
* GitHubRepository
* UserAccount
* GitHubUser
* TestNode
* Memory
* AWSInstanceProfile
* And more based on your data
Use the search box to find specific entity types.
### Center Panel: Graph View
The main visualization area shows:
* **Nodes** - Entities represented as circles
* **Edges** - Relationships shown as connecting lines
* **Labels** - Entity names and types
**Stats bar:**
* Node count (e.g., "100 nodes")
* Edge count (e.g., "95 edges")
### Right Panel: Node Details
When you click a node, the detail panel shows:
* Entity name and type
* Source information
* Properties and metadata
* Related entities
## Navigation Controls
### Zoom Controls
Located in the bottom-left:
* **+** Zoom in
* **-** Zoom out
* **Fit** Reset view to show all nodes
### Pan
Click and drag on empty space to pan the view.
### Select
Click a node to select it and view its details.
## Working with the Graph
### Filtering
1. Check/uncheck data sources to show/hide entities from those sources
2. Check/uncheck entity types to filter by type
3. Combine filters to focus on specific subsets
Start by filtering to a single entity type to reduce visual complexity, then expand as needed.
### Exploring Relationships
1. Click a node to select it
2. View its connections highlighted
3. Click connected nodes to traverse relationships
4. Use the detail panel to understand the entity
### Finding Specific Entities
Use the search bar at the top:
1. Enter the entity name or partial match
2. Select from suggestions
3. The view will focus on that entity
## Node Visualization
Nodes are sized and colored based on:
* **Entity type** - Different colors for different types
* **Connection count** - More connections = larger node
* **Importance** - Key entities are emphasized
## Performance Tips
For large graphs:
1. Use filters to reduce visible nodes
2. Focus on specific data sources
3. Limit to relevant entity types
4. Use the Entities table for searching large datasets
The explorer limits the visible nodes for performance. Use filters or the search to find specific entities in large graphs.
## Export
The graph view supports:
* Screenshot export
* Data export via the [Queries](/web-interface/context-graph/queries) interface
## Related Pages
* **[Context Graph Overview](/web-interface/context-graph/overview)** - Graph metrics dashboard
* **[Entities](/web-interface/context-graph/entities)** - Table view for searching
* **[Queries](/web-interface/context-graph/queries)** - Cypher query interface
* **[Meta Agent](/core-concepts/meta-agent)** - Natural language graph exploration
## Access
Click **Context Graph** > **Explorer** in the sidebar.
## Interface Layout
### Left Panel: Graph Filters
Filter the visible nodes and edges:
**Data Sources:**
Filter by where entities originated:
* Unknown
* Git
* User
* Test
* Memory
* Verification
* Module
* And more based on your connected sources
Each source shows the count of entities from that source.
**Entity Types:**
Filter by entity type:
* GITHUB\_KUBIYA
* GITHUB\_SEC\_F
* GitHubRepository
* UserAccount
* GitHubUser
* TestNode
* Memory
* AWSInstanceProfile
* And more based on your data
Use the search box to find specific entity types.
### Center Panel: Graph View
The main visualization area shows:
* **Nodes** - Entities represented as circles
* **Edges** - Relationships shown as connecting lines
* **Labels** - Entity names and types
**Stats bar:**
* Node count (e.g., "100 nodes")
* Edge count (e.g., "95 edges")
### Right Panel: Node Details
When you click a node, the detail panel shows:
* Entity name and type
* Source information
* Properties and metadata
* Related entities
## Navigation Controls
### Zoom Controls
Located in the bottom-left:
* **+** Zoom in
* **-** Zoom out
* **Fit** Reset view to show all nodes
### Pan
Click and drag on empty space to pan the view.
### Select
Click a node to select it and view its details.
## Working with the Graph
### Filtering
1. Check/uncheck data sources to show/hide entities from those sources
2. Check/uncheck entity types to filter by type
3. Combine filters to focus on specific subsets
Start by filtering to a single entity type to reduce visual complexity, then expand as needed.
### Exploring Relationships
1. Click a node to select it
2. View its connections highlighted
3. Click connected nodes to traverse relationships
4. Use the detail panel to understand the entity
### Finding Specific Entities
Use the search bar at the top:
1. Enter the entity name or partial match
2. Select from suggestions
3. The view will focus on that entity
## Node Visualization
Nodes are sized and colored based on:
* **Entity type** - Different colors for different types
* **Connection count** - More connections = larger node
* **Importance** - Key entities are emphasized
## Performance Tips
For large graphs:
1. Use filters to reduce visible nodes
2. Focus on specific data sources
3. Limit to relevant entity types
4. Use the Entities table for searching large datasets
The explorer limits the visible nodes for performance. Use filters or the search to find specific entities in large graphs.
## Export
The graph view supports:
* Screenshot export
* Data export via the [Queries](/web-interface/context-graph/queries) interface
## Related Pages
* **[Context Graph Overview](/web-interface/context-graph/overview)** - Graph metrics dashboard
* **[Entities](/web-interface/context-graph/entities)** - Table view for searching
* **[Queries](/web-interface/context-graph/queries)** - Cypher query interface
* **[Meta Agent](/core-concepts/meta-agent)** - Natural language graph exploration