> ## Documentation Index
> Fetch the complete documentation index at: https://docs.kubiya.ai/llms.txt
> Use this file to discover all available pages before exploring further.
# Queries
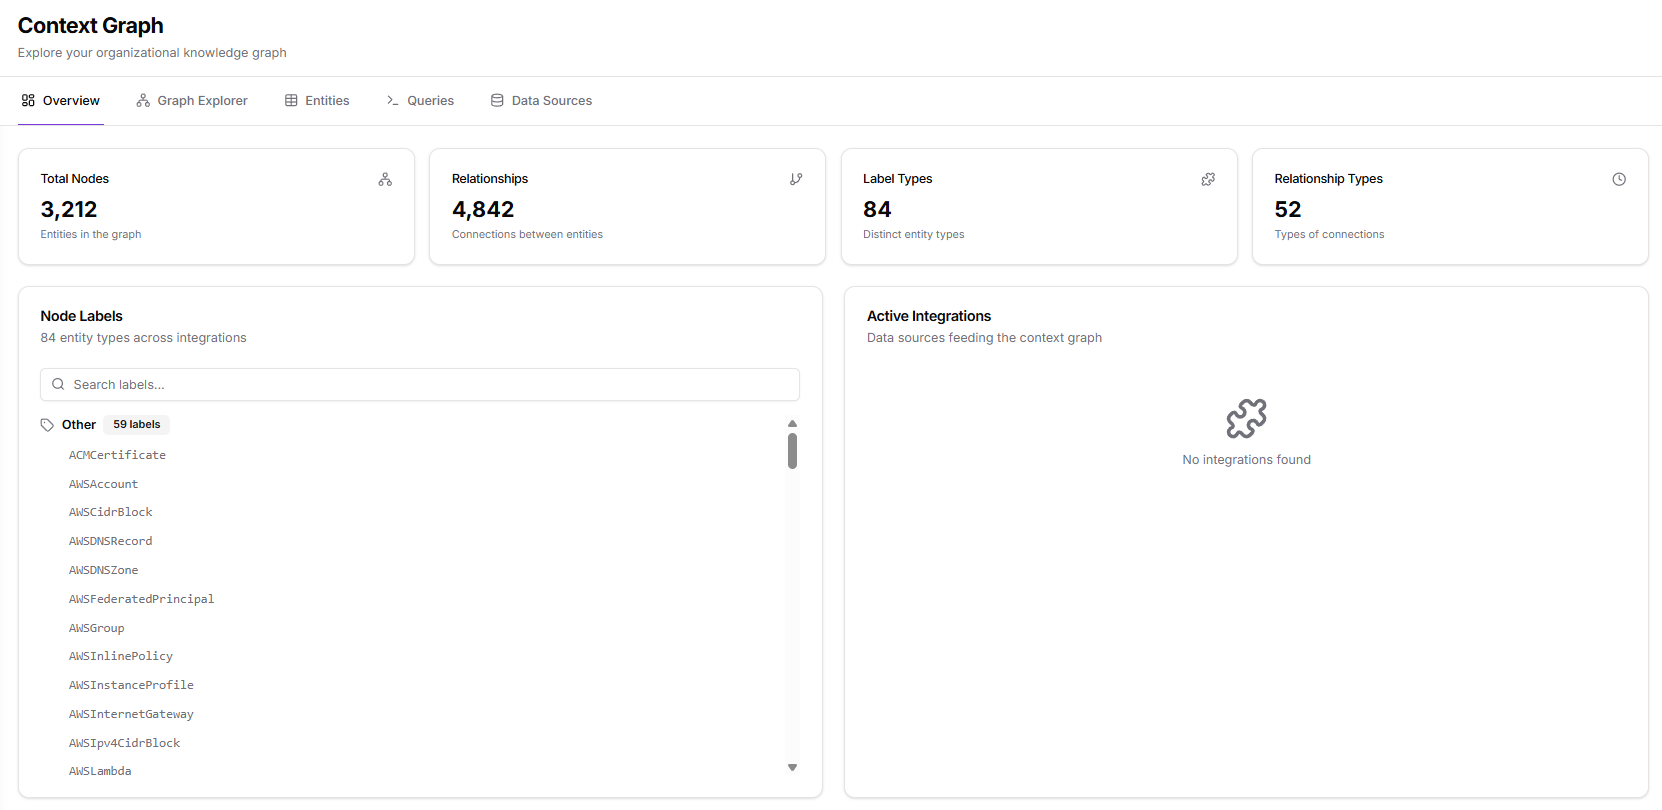
> High‑level summary of Kubiya’s Context Graph: aggregated entities and relationships from integrations, with metrics for nodes, relationships, label types, and active sources.
 **Prefer Natural Language?** The [Meta Agent](/core-concepts/meta-agent) lets you query the Context Graph conversationally without writing Cypher. Use this Queries page for advanced analysis, custom reporting, or programmatic access via SDK/API.
The **Queries** page provides a powerful interface for running Cypher queries directly against the Context Graph. It is designed for users who want more targeted, analytical, or programmatic access to the graph than what the Graph Explorer or Entities table provides. The query editor allows you to retrieve nodes, explore relationships, aggregate statistics, and export results in CSV or JSON format.
This page is ideal for deeper investigation, reporting, and custom graph analysis.
## **Prerequisites**
To use Queries effectively:
* The Context Graph must contain ingested nodes and relationships
* You should have some familiarity with Cypher syntax
* Ingested data should be up to date to ensure accurate query results
Queries run against the live graph, and performance depends on dataset size and query complexity.
## **Page Layout and Components**
The Queries page is divided into four major areas:
1. **Query Editor:** write, modify, and execute Cypher queries
2. **Query History:** access previously executed queries
3. **Example Queries:** curated examples optimized for the backend
4. **Results Panel:** view, expand, and export query results
This layout supports both exploratory querying and repeated workflows.
## **Query Editor**
The Query Editor is where you write your Cypher statements.
It includes:
* A multiline editor for typing queries
* A keyboard shortcut to run queries (Cmd/Ctrl + Enter)
* An **Execute** button
* Icons for opening query history and example queries
* A button to clear the editor
The editor accepts any valid Cypher that the backend supports.
Examples shown in the screenshots use:
```sql theme={null}
MATCH (n)
RETURN n
LIMIT 20
```
Output always appears in the Results Panel on the right.
## **Query History**
The history panel stores your recent executed queries, with timestamps and the number of returned rows.
History includes:
* A full list of past queries
* Re-run capability by clicking a past entry
* Clear option to remove history
This feature is useful for iterative workflows or debugging complex queries.
## **Example Queries**
Below the editor is a collapsible **Example Queries** section.
These examples are optimized to work with backend limitations and provide common patterns users need.
Examples include:
### **Get all nodes**
Retrieves nodes with full label visibility.
```sql theme={null}
MATCH (n) RETURN n LIMIT 20
```
### **Get nodes with properties**
Returns nodes that have non-null `name` or `id`.
```sql theme={null}
MATCH (n) WHERE n.name IS NOT NULL OR n.id IS NOT NULL
RETURN n.id as id, n.name as name, n LIMIT 20
```
### **Find nodes with relationships**
Shows nodes together with their relationship details.
```sql theme={null}
MATCH (source)-[r]->(target)
WITH source, target, type(r) as rel_type
RETURN source.id as source_id, rel_type as relationship, target.id as target_id, source, target LIMIT 20
```
### **Count relationships by type**
Useful for relationship statistics.
```sql theme={null}
MATCH (source)-[r]->(target)
WITH r
RETURN type(r) as relationship_type, count(*) as count
ORDER BY count DESC
```
### **Find nodes by property**
Query nodes by a property such as `type`.
```sql theme={null}
MATCH (n) WHERE n.type IS NOT NULL
RETURN n.type as type, count(*) as count
ORDER BY count DESC LIMIT 20
```
### **Search by property value**
Search nodes by name or any other indexed field.
```sql theme={null}
MATCH (n) WHERE n.name CONTAINS 'YOUR_SEARCH_TERM'
RETURN n LIMIT 10
```
These examples help new users get started quickly while providing a reference for more advanced patterns.
## **Executing Queries**
Once a query is written:
* Press **Execute**
* Or use **Cmd/Ctrl + Enter**
After execution:
* The query appears in **Query History**
* The results populate instantly in the Results Panel
* Errors (syntax or backend) are returned inline
Execution is stateless: each run fetches fresh data from the underlying graph.
## **Results Panel**
The right side of the page displays query results.
Results appear in a scrollable list with each row formatted as a JSON-like object.
Rows expand into full JSON when stretched vertically or interacted with.
Key features include:
### **Rows Count**
Displayed above results (e.g., *20 rows*).
### **Per-row JSON Viewer**
Each row is rendered as a structured object that:
* Shows all node properties
* Includes nested fields
* Respects full ingestion structure
Some results include large JSON documents; the viewer handles them cleanly.
### **On-demand formatting**
Clicking a row expands the JSON for easier inspection.
### **Export Controls**
Two export options are available:
* **CSV**
* **JSON**
Exports reflect the full result set of the executed query.
## **How Queries Help**
This page is essential when you need:
* Precise graph analysis that goes beyond visual exploration
* Custom queries for reporting or audits
* Fast filtering across thousands of nodes
* Relationship inspection across multiple labels
* Aggregation, grouping, or statistical summaries
* Repeatable analysis using saved or historical queries
Queries are especially useful for advanced users who need to understand the structure, distribution, or anomalies within the graph.
## **What’s Next**
Once you are comfortable querying the graph, the next section helps you understand the sources powering the graph:
* **Data Sources**
View all connected integrations, ingestion counts, and available types, helping you identify where your graph data originates.
**Prefer Natural Language?** The [Meta Agent](/core-concepts/meta-agent) lets you query the Context Graph conversationally without writing Cypher. Use this Queries page for advanced analysis, custom reporting, or programmatic access via SDK/API.
The **Queries** page provides a powerful interface for running Cypher queries directly against the Context Graph. It is designed for users who want more targeted, analytical, or programmatic access to the graph than what the Graph Explorer or Entities table provides. The query editor allows you to retrieve nodes, explore relationships, aggregate statistics, and export results in CSV or JSON format.
This page is ideal for deeper investigation, reporting, and custom graph analysis.
## **Prerequisites**
To use Queries effectively:
* The Context Graph must contain ingested nodes and relationships
* You should have some familiarity with Cypher syntax
* Ingested data should be up to date to ensure accurate query results
Queries run against the live graph, and performance depends on dataset size and query complexity.
## **Page Layout and Components**
The Queries page is divided into four major areas:
1. **Query Editor:** write, modify, and execute Cypher queries
2. **Query History:** access previously executed queries
3. **Example Queries:** curated examples optimized for the backend
4. **Results Panel:** view, expand, and export query results
This layout supports both exploratory querying and repeated workflows.
## **Query Editor**
The Query Editor is where you write your Cypher statements.
It includes:
* A multiline editor for typing queries
* A keyboard shortcut to run queries (Cmd/Ctrl + Enter)
* An **Execute** button
* Icons for opening query history and example queries
* A button to clear the editor
The editor accepts any valid Cypher that the backend supports.
Examples shown in the screenshots use:
```sql theme={null}
MATCH (n)
RETURN n
LIMIT 20
```
Output always appears in the Results Panel on the right.
## **Query History**
The history panel stores your recent executed queries, with timestamps and the number of returned rows.
History includes:
* A full list of past queries
* Re-run capability by clicking a past entry
* Clear option to remove history
This feature is useful for iterative workflows or debugging complex queries.
## **Example Queries**
Below the editor is a collapsible **Example Queries** section.
These examples are optimized to work with backend limitations and provide common patterns users need.
Examples include:
### **Get all nodes**
Retrieves nodes with full label visibility.
```sql theme={null}
MATCH (n) RETURN n LIMIT 20
```
### **Get nodes with properties**
Returns nodes that have non-null `name` or `id`.
```sql theme={null}
MATCH (n) WHERE n.name IS NOT NULL OR n.id IS NOT NULL
RETURN n.id as id, n.name as name, n LIMIT 20
```
### **Find nodes with relationships**
Shows nodes together with their relationship details.
```sql theme={null}
MATCH (source)-[r]->(target)
WITH source, target, type(r) as rel_type
RETURN source.id as source_id, rel_type as relationship, target.id as target_id, source, target LIMIT 20
```
### **Count relationships by type**
Useful for relationship statistics.
```sql theme={null}
MATCH (source)-[r]->(target)
WITH r
RETURN type(r) as relationship_type, count(*) as count
ORDER BY count DESC
```
### **Find nodes by property**
Query nodes by a property such as `type`.
```sql theme={null}
MATCH (n) WHERE n.type IS NOT NULL
RETURN n.type as type, count(*) as count
ORDER BY count DESC LIMIT 20
```
### **Search by property value**
Search nodes by name or any other indexed field.
```sql theme={null}
MATCH (n) WHERE n.name CONTAINS 'YOUR_SEARCH_TERM'
RETURN n LIMIT 10
```
These examples help new users get started quickly while providing a reference for more advanced patterns.
## **Executing Queries**
Once a query is written:
* Press **Execute**
* Or use **Cmd/Ctrl + Enter**
After execution:
* The query appears in **Query History**
* The results populate instantly in the Results Panel
* Errors (syntax or backend) are returned inline
Execution is stateless: each run fetches fresh data from the underlying graph.
## **Results Panel**
The right side of the page displays query results.
Results appear in a scrollable list with each row formatted as a JSON-like object.
Rows expand into full JSON when stretched vertically or interacted with.
Key features include:
### **Rows Count**
Displayed above results (e.g., *20 rows*).
### **Per-row JSON Viewer**
Each row is rendered as a structured object that:
* Shows all node properties
* Includes nested fields
* Respects full ingestion structure
Some results include large JSON documents; the viewer handles them cleanly.
### **On-demand formatting**
Clicking a row expands the JSON for easier inspection.
### **Export Controls**
Two export options are available:
* **CSV**
* **JSON**
Exports reflect the full result set of the executed query.
## **How Queries Help**
This page is essential when you need:
* Precise graph analysis that goes beyond visual exploration
* Custom queries for reporting or audits
* Fast filtering across thousands of nodes
* Relationship inspection across multiple labels
* Aggregation, grouping, or statistical summaries
* Repeatable analysis using saved or historical queries
Queries are especially useful for advanced users who need to understand the structure, distribution, or anomalies within the graph.
## **What’s Next**
Once you are comfortable querying the graph, the next section helps you understand the sources powering the graph:
* **Data Sources**
View all connected integrations, ingestion counts, and available types, helping you identify where your graph data originates.