> ## Documentation Index
> Fetch the complete documentation index at: https://docs.kubiya.ai/llms.txt
> Use this file to discover all available pages before exploring further.
# Graph Visualization
> Visualize your organizational knowledge graph with filters, search, node limits, and detailed panels to analyze relationships, dependencies, and structure.
**Looking to explore your infrastructure interactively?** The Graph Visualization tool is designed for **visual analysis**—viewing topology, understanding structure, and analyzing relationships spatially. For **interactive exploration** (asking questions, discovering insights, querying data), use the **[Meta Agent](/core-concepts/meta-agent)** instead. The Meta Agent lets you explore the same data through natural language conversation.
The Graph Visualization provides a visual interface for analyzing your organizational knowledge graph. It allows you to view entities as nodes, understand how they relate to each other through relationships, inspect node-level details, and focus on specific parts of the graph through filtering and dynamic layout controls.
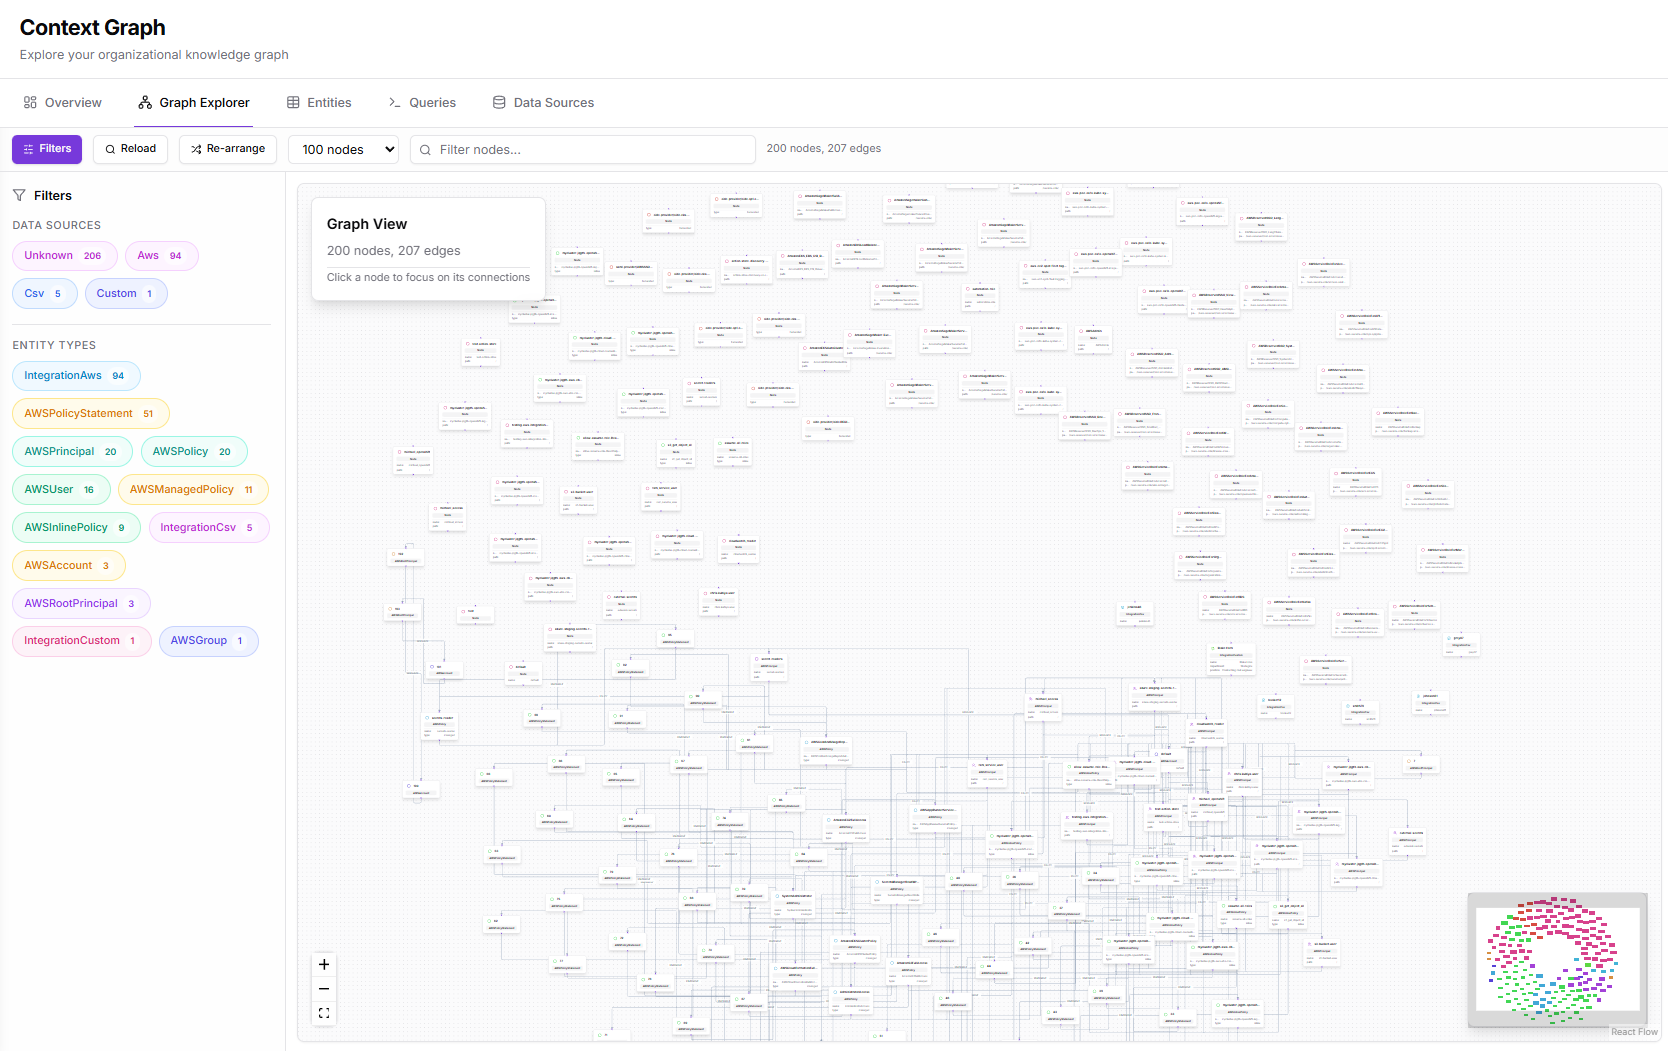 This view is ideal for **analyzing structure**, **understanding topology**, or **visually investigating** how resources, identities, policies, and other objects are connected across your systems. When you need to see the "shape" of your infrastructure or analyze clusters of related resources, the Graph Visualization is the right tool.
## **Prerequisites**
To work effectively with the Graph Explorer:
* At least one integration or data source must supply entities and relationships
* The Context Graph must contain a meaningful number of nodes for exploration
* Data types and labels must be ingested before filter options become available
Without connected data, the graph will load but contain few or no visualized nodes.
## **Page Layout and Components**
The Graph Explorer consists of three primary areas:
1. **Filters Panel** (left): controls what subset of the graph is shown
2. **Toolbar** (top): actions such as reload, re-arrange, node limit selection, and search
3. **Graph Canvas** (center): the interactive visualization
4. **Node Details Panel** (right, when a node is selected): properties, labels, metadata, navigation to full details
These components work together to provide both a high-level overview and deep inspection of any entity.
## **Filters Panel**
This view is ideal for **analyzing structure**, **understanding topology**, or **visually investigating** how resources, identities, policies, and other objects are connected across your systems. When you need to see the "shape" of your infrastructure or analyze clusters of related resources, the Graph Visualization is the right tool.
## **Prerequisites**
To work effectively with the Graph Explorer:
* At least one integration or data source must supply entities and relationships
* The Context Graph must contain a meaningful number of nodes for exploration
* Data types and labels must be ingested before filter options become available
Without connected data, the graph will load but contain few or no visualized nodes.
## **Page Layout and Components**
The Graph Explorer consists of three primary areas:
1. **Filters Panel** (left): controls what subset of the graph is shown
2. **Toolbar** (top): actions such as reload, re-arrange, node limit selection, and search
3. **Graph Canvas** (center): the interactive visualization
4. **Node Details Panel** (right, when a node is selected): properties, labels, metadata, navigation to full details
These components work together to provide both a high-level overview and deep inspection of any entity.
## **Filters Panel**
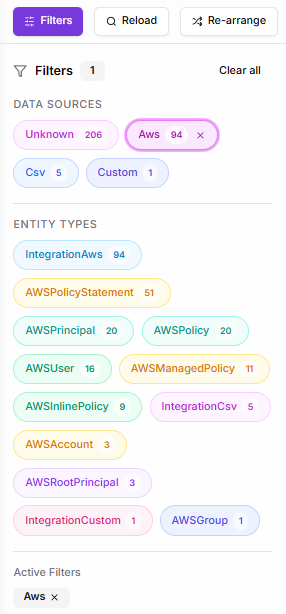 ### **Data Sources**
This section displays all data sources present in the graph, such as:
* AWS
* CSV
* Custom
* Unknown
Each data source tag shows a count of nodes originating from that source. Selecting a data source filter limits the graph to only entities created by that ingestion path.
### **Entity Types**
The Entity Types section lists all node labels available in the graph, each with a count of how many nodes of that type exist.
Examples include:
* `AWSUser`
* `AWSRole`
* `AWSPolicy`
* `AWSManagedPolicy`
* `AWSAccount`
* `AWSPrincipal`, `AWSRootPrincipal`
* `IntegrationAws`, `IntegrationCsv`, `IntegrationCustom`
* and many others depending on the dataset
Selecting one or more labels filters the visualization to nodes of those types only.
### **Active Filters**
When filters are applied, they appear in a dedicated **Active Filters** section, allowing users to:
* See which filters are currently affecting the visualization
* Remove individual filters directly
* Clear all filters at once
This helps maintain visibility into how the graph view is being constrained.
## **Toolbar Actions**
### **Reload**
Refreshes the visual graph by re-fetching nodes and relationships according to the current filters.
Useful after data source updates or when switching between environments.
### **Re-arrange**
Recalculates the graph layout and redistributes nodes.
This is especially helpful when:
* Switching filters
* Zooming in/out
* The layout becomes visually cluttered
* You want a cleaner, more readable layout
The graph engine repositions nodes for optimal clarity while preserving the structure of relationships.
### **Node Limit Selector**
A dropdown lets users choose how many nodes to load into the canvas at once:
* **50 nodes** - Quick exploration, fastest loading
* **100 nodes** - Default view, good balance
* **250 nodes** - More comprehensive view
* **500 nodes** - Recommended for thorough analysis
* **1000 nodes** - Maximum view for complete graph exploration
For thorough graph exploration, we recommend setting the node limit to **500 nodes**. This provides a comprehensive view of entity relationships while maintaining good performance.
Smaller views load faster and are easier to interpret, while larger views provide a more complete picture of complex systems.
The current node/edge count is always shown in the header (e.g., *500 nodes, 612 edges*).
### **Search (Filter Nodes…)**
Provides text-based filtering across node names and key properties.
Typing in this field dynamically reduces the graph to only nodes matching the query.
This is useful for locating:
* Specific resource names
* IAM identities
* Policies
* Custom integration records
* Any node identifiable by ingested metadata
## **Graph Canvas**
### **Data Sources**
This section displays all data sources present in the graph, such as:
* AWS
* CSV
* Custom
* Unknown
Each data source tag shows a count of nodes originating from that source. Selecting a data source filter limits the graph to only entities created by that ingestion path.
### **Entity Types**
The Entity Types section lists all node labels available in the graph, each with a count of how many nodes of that type exist.
Examples include:
* `AWSUser`
* `AWSRole`
* `AWSPolicy`
* `AWSManagedPolicy`
* `AWSAccount`
* `AWSPrincipal`, `AWSRootPrincipal`
* `IntegrationAws`, `IntegrationCsv`, `IntegrationCustom`
* and many others depending on the dataset
Selecting one or more labels filters the visualization to nodes of those types only.
### **Active Filters**
When filters are applied, they appear in a dedicated **Active Filters** section, allowing users to:
* See which filters are currently affecting the visualization
* Remove individual filters directly
* Clear all filters at once
This helps maintain visibility into how the graph view is being constrained.
## **Toolbar Actions**
### **Reload**
Refreshes the visual graph by re-fetching nodes and relationships according to the current filters.
Useful after data source updates or when switching between environments.
### **Re-arrange**
Recalculates the graph layout and redistributes nodes.
This is especially helpful when:
* Switching filters
* Zooming in/out
* The layout becomes visually cluttered
* You want a cleaner, more readable layout
The graph engine repositions nodes for optimal clarity while preserving the structure of relationships.
### **Node Limit Selector**
A dropdown lets users choose how many nodes to load into the canvas at once:
* **50 nodes** - Quick exploration, fastest loading
* **100 nodes** - Default view, good balance
* **250 nodes** - More comprehensive view
* **500 nodes** - Recommended for thorough analysis
* **1000 nodes** - Maximum view for complete graph exploration
For thorough graph exploration, we recommend setting the node limit to **500 nodes**. This provides a comprehensive view of entity relationships while maintaining good performance.
Smaller views load faster and are easier to interpret, while larger views provide a more complete picture of complex systems.
The current node/edge count is always shown in the header (e.g., *500 nodes, 612 edges*).
### **Search (Filter Nodes…)**
Provides text-based filtering across node names and key properties.
Typing in this field dynamically reduces the graph to only nodes matching the query.
This is useful for locating:
* Specific resource names
* IAM identities
* Policies
* Custom integration records
* Any node identifiable by ingested metadata
## **Graph Canvas**
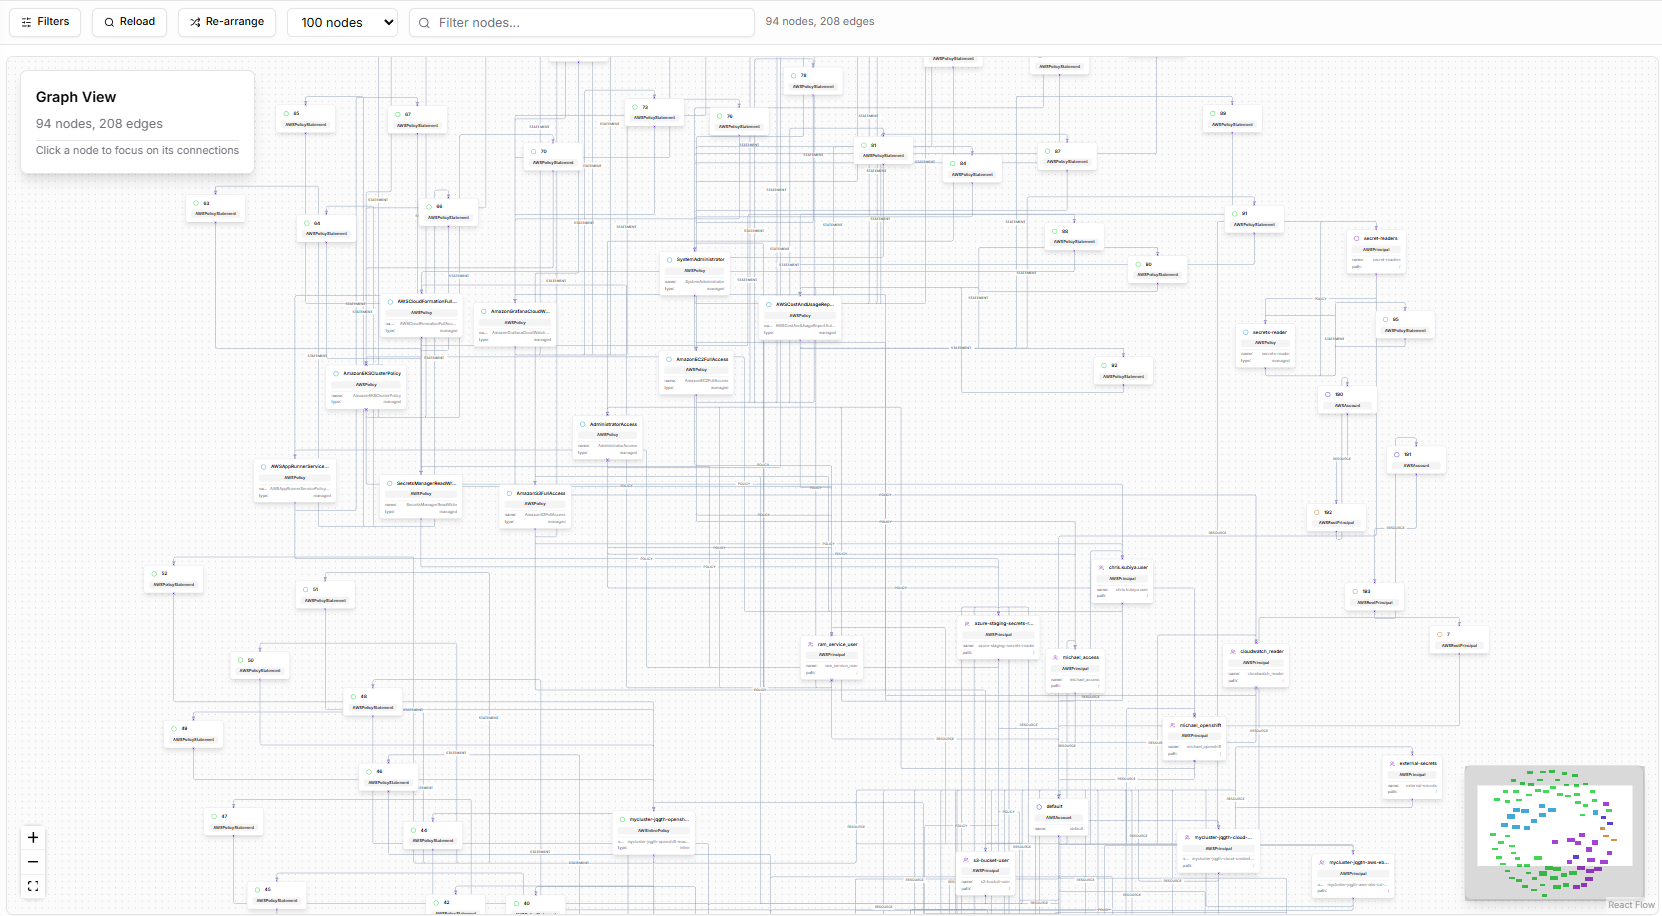 The main visualization shows nodes and edges with:
* Entity type labels
* Relationship names (e.g., POLICY)
* Clusters where resources are heavily interconnected
* A miniature map in the bottom-right for navigation
### **Interaction Capabilities**
Users can:
* **Pan** across the graph
* **Zoom** in or out
* **Drag** nodes to manually reposition them
* **Click** a node to open its details
* **Hover** for quick type/label confirmation
The canvas dynamically updates with every filter or limit change.
## **Node Details Panel**
The main visualization shows nodes and edges with:
* Entity type labels
* Relationship names (e.g., POLICY)
* Clusters where resources are heavily interconnected
* A miniature map in the bottom-right for navigation
### **Interaction Capabilities**
Users can:
* **Pan** across the graph
* **Zoom** in or out
* **Drag** nodes to manually reposition them
* **Click** a node to open its details
* **Hover** for quick type/label confirmation
The canvas dynamically updates with every filter or limit change.
## **Node Details Panel**
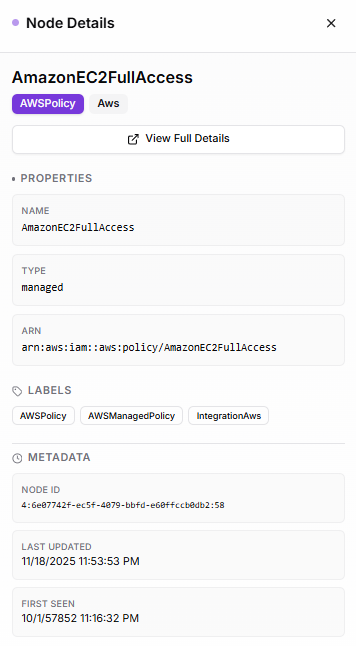 Clicking any node opens a detailed information panel on the right.
This panel includes:
### **Labels**
All labels assigned to the node, such as:
* `AWSPolicy`
* `AWSManagedPolicy`
* `IntegrationAws`
### **Properties**
Structured properties ingested from the data source, such as:
* Name
* Type
* ARNs (for AWS resources)
* Identifiers
* Any relevant metadata included by the integration
### **Metadata**
Graph-level metadata:
* Node ID
* First Seen timestamp
* Last Updated timestamp
These values help trace ingestion history and verify data freshness.
### **Relationships**
Shows connected nodes, including number of inbound/outbound links.
This helps understand how a node fits into the greater graph topology.
### **View Full Details**
A link that takes the user to a dedicated page for the selected entity in the **Entities** section.
That page includes:
* Full raw JSON
* All relationships
* Property expansion
* Full metadata
* Structured navigation between entities
This is the primary way to jump deeper into an entity after discovering it in the graph.
## **Graph Loading and Update Behavior**
When the Graph Explorer fetches updated data due to filter changes or reload actions, users see:
* A progress indicator (e.g., *Updating relationships 100/100*)
* A loading animation
* Gradual completion of relationship fetches
The graph is rendered only after loading is fully complete to avoid partial or inaccurate layouts.
## **When to Use Graph Visualization**
| Use Case | Graph Visualization | Meta Agent |
| ------------------------------------------ | ------------------- | ------------- |
| See the topology of your infrastructure | ✅ Best choice | |
| Visually trace IAM permission chains | ✅ Best choice | |
| Understand cluster relationships spatially | ✅ Best choice | |
| Ask questions about your infrastructure | | ✅ Best choice |
| Get insights and recommendations | | ✅ Best choice |
| Query specific relationships | | ✅ Best choice |
| Discover what depends on a resource | | ✅ Best choice |
**Graph Visualization excels at:**
* Tracing AWS IAM permission relationships visually
* Inspecting associations between policies, users, roles, and managed policies
* Viewing network-level relationships between subnets, ACLs, and routes
* Identifying dependency clusters between resources
* Visually debugging unexpected resource or identity relationships
* Detecting missing, misconfigured, or overly-permissive links
* Understanding how custom ingestion data connects to cloud or identity systems
It is the most intuitive way to **see** your environment as a connected system rather than as isolated objects.
## **What's Next**
The Graph Visualization gives you a visual understanding of your data. Continue exploring through:
* **[Meta Agent](/core-concepts/meta-agent)**
Explore infrastructure interactively through natural language conversation. Ask questions, get insights, and discover relationships without writing queries.
* **[Entities](/core-concepts/entities)**
Inspect every node in a structured table, open detailed views, and explore properties and metadata.
* **[Queries](/core-concepts/queries)**
Write and execute Cypher queries for advanced programmatic analysis and SDK/API integration.
* **[Data Ingestion](/core-concepts/data-sources)**
Review the ingestion sources feeding the graph, verify sync status, and add new sources.
Clicking any node opens a detailed information panel on the right.
This panel includes:
### **Labels**
All labels assigned to the node, such as:
* `AWSPolicy`
* `AWSManagedPolicy`
* `IntegrationAws`
### **Properties**
Structured properties ingested from the data source, such as:
* Name
* Type
* ARNs (for AWS resources)
* Identifiers
* Any relevant metadata included by the integration
### **Metadata**
Graph-level metadata:
* Node ID
* First Seen timestamp
* Last Updated timestamp
These values help trace ingestion history and verify data freshness.
### **Relationships**
Shows connected nodes, including number of inbound/outbound links.
This helps understand how a node fits into the greater graph topology.
### **View Full Details**
A link that takes the user to a dedicated page for the selected entity in the **Entities** section.
That page includes:
* Full raw JSON
* All relationships
* Property expansion
* Full metadata
* Structured navigation between entities
This is the primary way to jump deeper into an entity after discovering it in the graph.
## **Graph Loading and Update Behavior**
When the Graph Explorer fetches updated data due to filter changes or reload actions, users see:
* A progress indicator (e.g., *Updating relationships 100/100*)
* A loading animation
* Gradual completion of relationship fetches
The graph is rendered only after loading is fully complete to avoid partial or inaccurate layouts.
## **When to Use Graph Visualization**
| Use Case | Graph Visualization | Meta Agent |
| ------------------------------------------ | ------------------- | ------------- |
| See the topology of your infrastructure | ✅ Best choice | |
| Visually trace IAM permission chains | ✅ Best choice | |
| Understand cluster relationships spatially | ✅ Best choice | |
| Ask questions about your infrastructure | | ✅ Best choice |
| Get insights and recommendations | | ✅ Best choice |
| Query specific relationships | | ✅ Best choice |
| Discover what depends on a resource | | ✅ Best choice |
**Graph Visualization excels at:**
* Tracing AWS IAM permission relationships visually
* Inspecting associations between policies, users, roles, and managed policies
* Viewing network-level relationships between subnets, ACLs, and routes
* Identifying dependency clusters between resources
* Visually debugging unexpected resource or identity relationships
* Detecting missing, misconfigured, or overly-permissive links
* Understanding how custom ingestion data connects to cloud or identity systems
It is the most intuitive way to **see** your environment as a connected system rather than as isolated objects.
## **What's Next**
The Graph Visualization gives you a visual understanding of your data. Continue exploring through:
* **[Meta Agent](/core-concepts/meta-agent)**
Explore infrastructure interactively through natural language conversation. Ask questions, get insights, and discover relationships without writing queries.
* **[Entities](/core-concepts/entities)**
Inspect every node in a structured table, open detailed views, and explore properties and metadata.
* **[Queries](/core-concepts/queries)**
Write and execute Cypher queries for advanced programmatic analysis and SDK/API integration.
* **[Data Ingestion](/core-concepts/data-sources)**
Review the ingestion sources feeding the graph, verify sync status, and add new sources.