> ## Documentation Index
> Fetch the complete documentation index at: https://docs.kubiya.ai/llms.txt
> Use this file to discover all available pages before exploring further.
# Data Ingestion
> Configure ingestion sources to populate the Context Graph with entities and relationships from cloud providers, identity systems, DevOps tools, and custom data.
 Data Ingestion connects external systems to populate your Context Graph. Once ingested, you can explore your infrastructure through the [Meta Agent](/core-concepts/meta-agent), visualize relationships in the [Graph Explorer](/core-concepts/graph-explorer), and query data programmatically.
**Ingestion Sources vs Connectors:** Ingestion Sources populate the Context Graph with **data** for analysis. [Connectors](/infrastructure/integrations) enable agents to **act** on external systems. You may need both: an ingestion source to index your AWS resources, and an AWS connector to allow agents to manage them.
## **Data Ingestion Pages**
Navigate to **Context Graph** in the sidebar to access:
| Page | Purpose |
| ------------- | --------------------------------------- |
| **Sources** | Configure and manage data sources |
| **Pipelines** | Monitor ingestion workflow executions |
| **Activity** | View historical activity and statistics |
***
## **Sources**
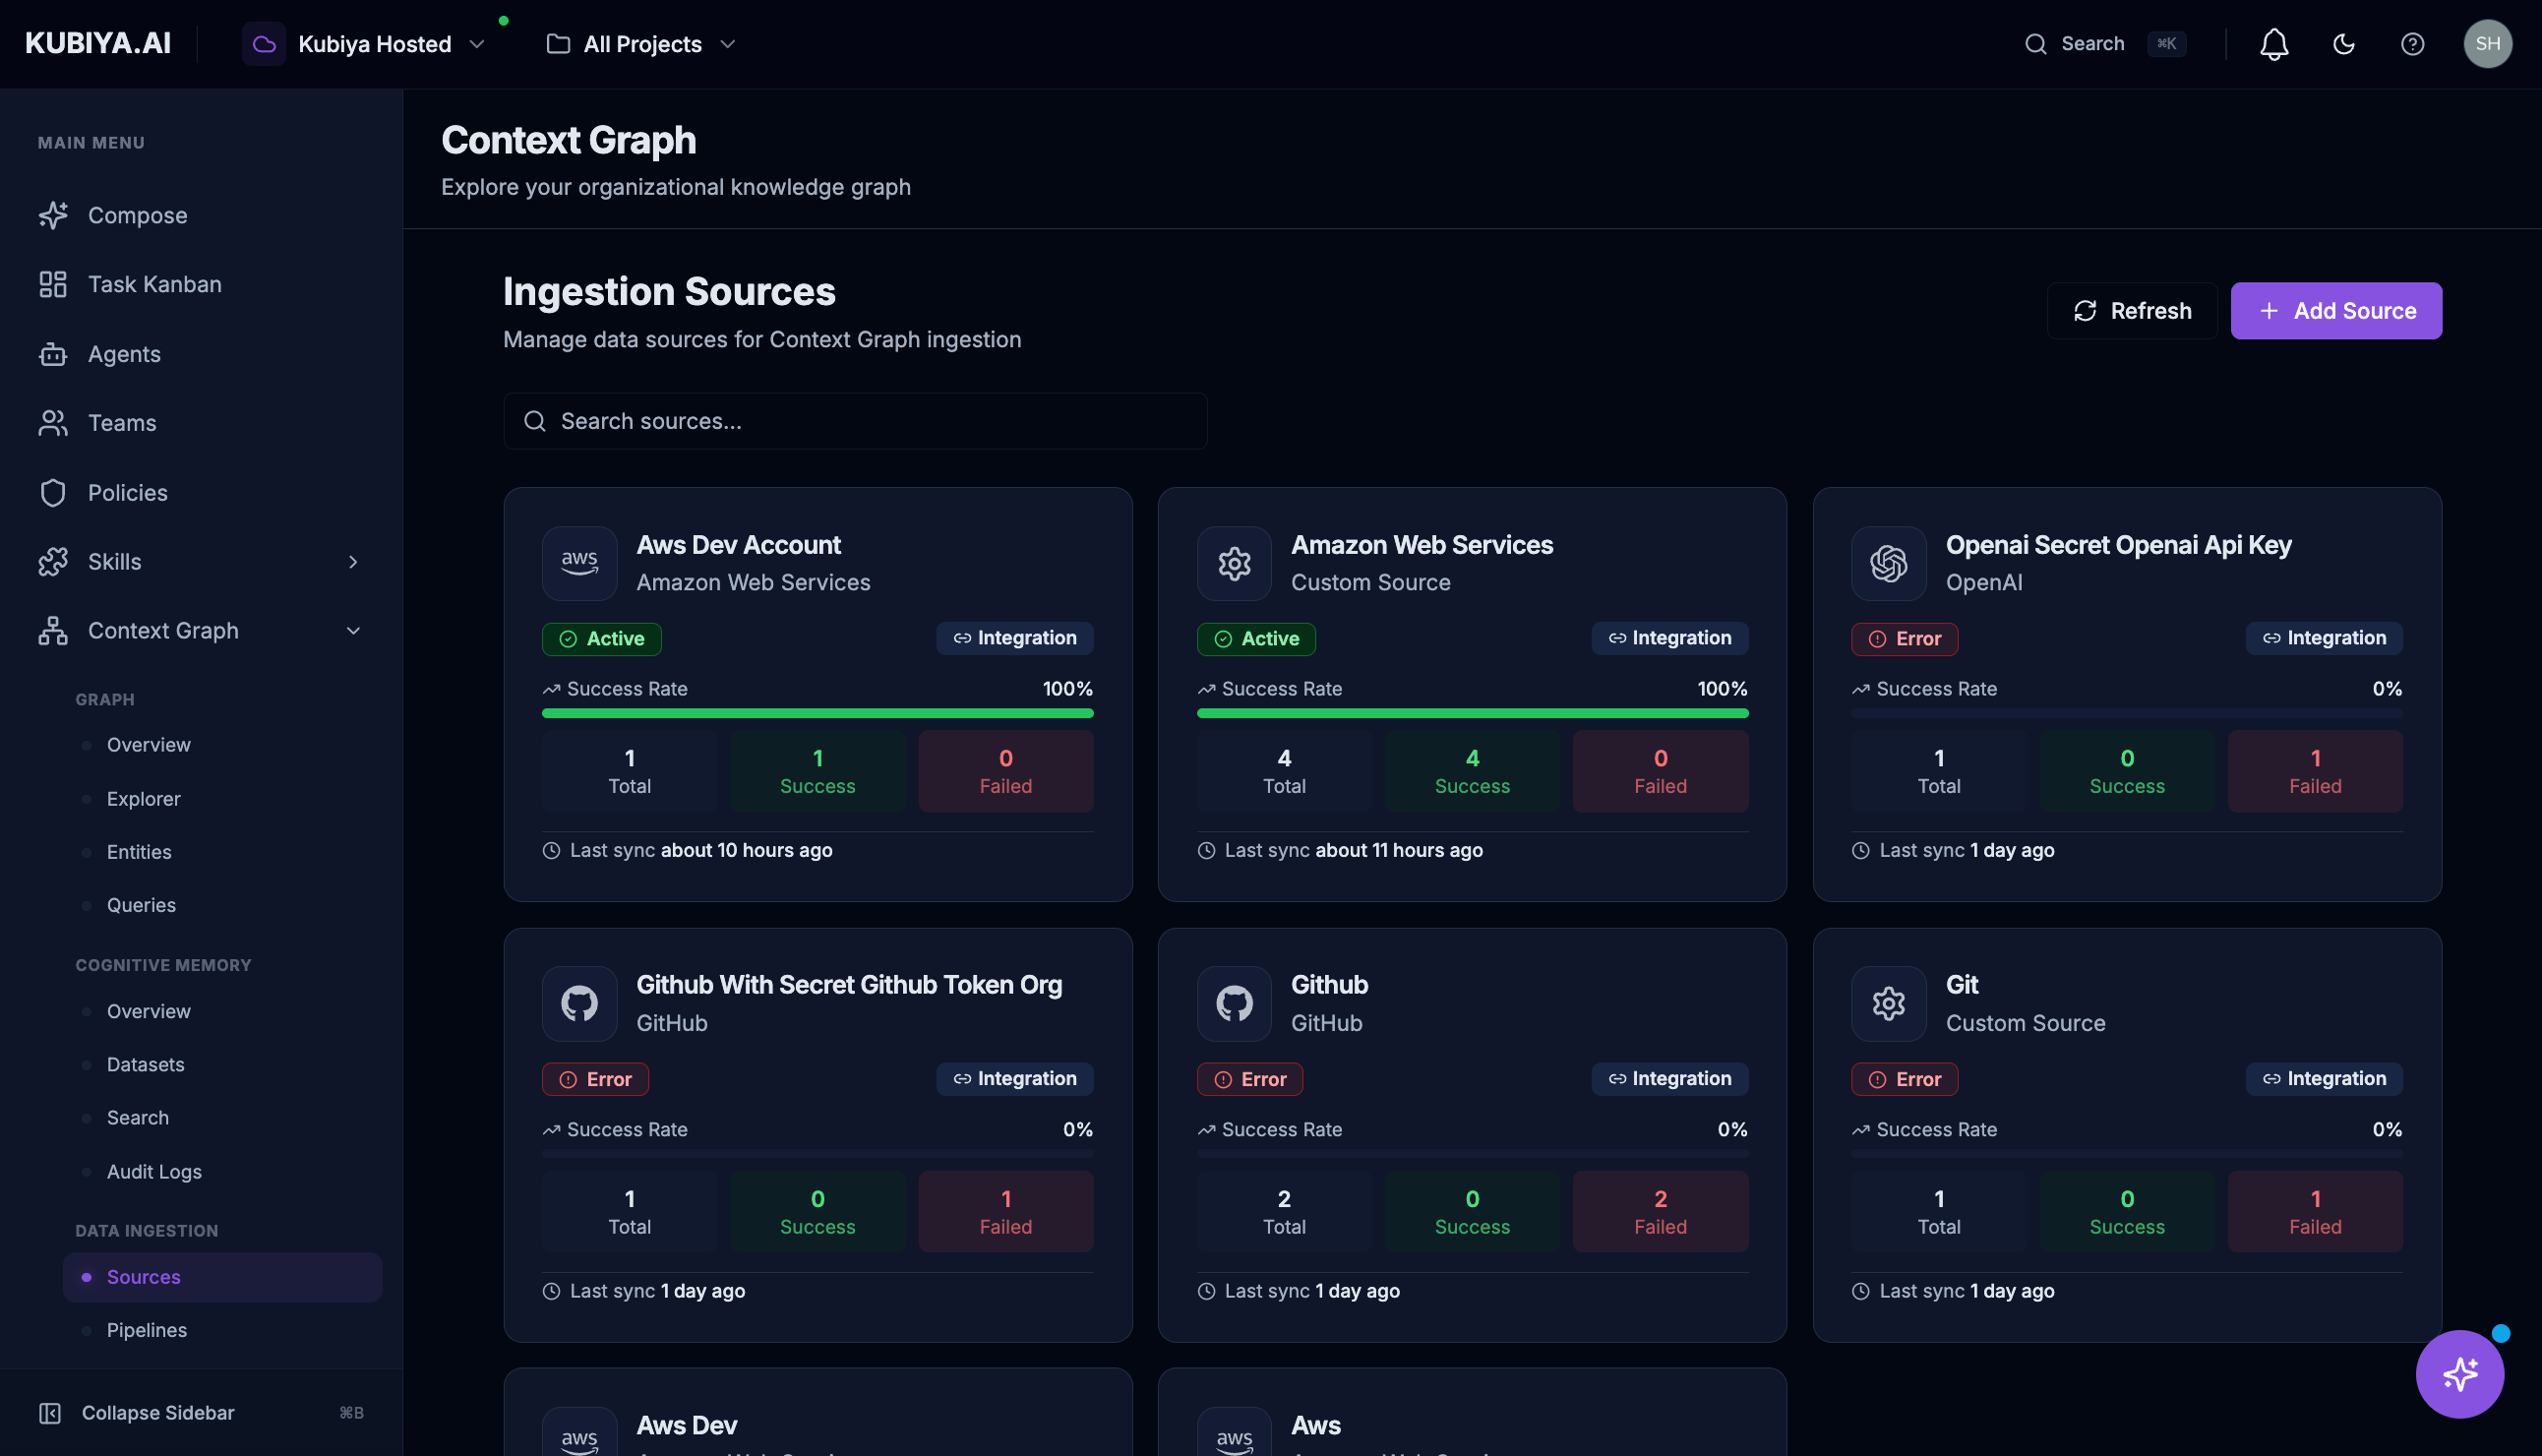
The Sources page displays all configured ingestion sources with their sync status.
### **Source Card Information**
Each source card shows:
* **Name** and **Type** (e.g., AWS, GitHub, Custom)
* **Status**: Active (green), Error (red), or Inactive
* **Success Rate**: Percentage of successful syncs
* **Stats**: Total runs, successes, and failures
* **Last Sync**: When the source was last synchronized
### **Adding an Ingestion Source**
Click **Add Source** to open the 3-step wizard:
**Step 1: Select Source Type**
Data Ingestion connects external systems to populate your Context Graph. Once ingested, you can explore your infrastructure through the [Meta Agent](/core-concepts/meta-agent), visualize relationships in the [Graph Explorer](/core-concepts/graph-explorer), and query data programmatically.
**Ingestion Sources vs Connectors:** Ingestion Sources populate the Context Graph with **data** for analysis. [Connectors](/infrastructure/integrations) enable agents to **act** on external systems. You may need both: an ingestion source to index your AWS resources, and an AWS connector to allow agents to manage them.
## **Data Ingestion Pages**
Navigate to **Context Graph** in the sidebar to access:
| Page | Purpose |
| ------------- | --------------------------------------- |
| **Sources** | Configure and manage data sources |
| **Pipelines** | Monitor ingestion workflow executions |
| **Activity** | View historical activity and statistics |
***
## **Sources**
The Sources page displays all configured ingestion sources with their sync status.
### **Source Card Information**
Each source card shows:
* **Name** and **Type** (e.g., AWS, GitHub, Custom)
* **Status**: Active (green), Error (red), or Inactive
* **Success Rate**: Percentage of successful syncs
* **Stats**: Total runs, successes, and failures
* **Last Sync**: When the source was last synchronized
### **Adding an Ingestion Source**
Click **Add Source** to open the 3-step wizard:
**Step 1: Select Source Type**
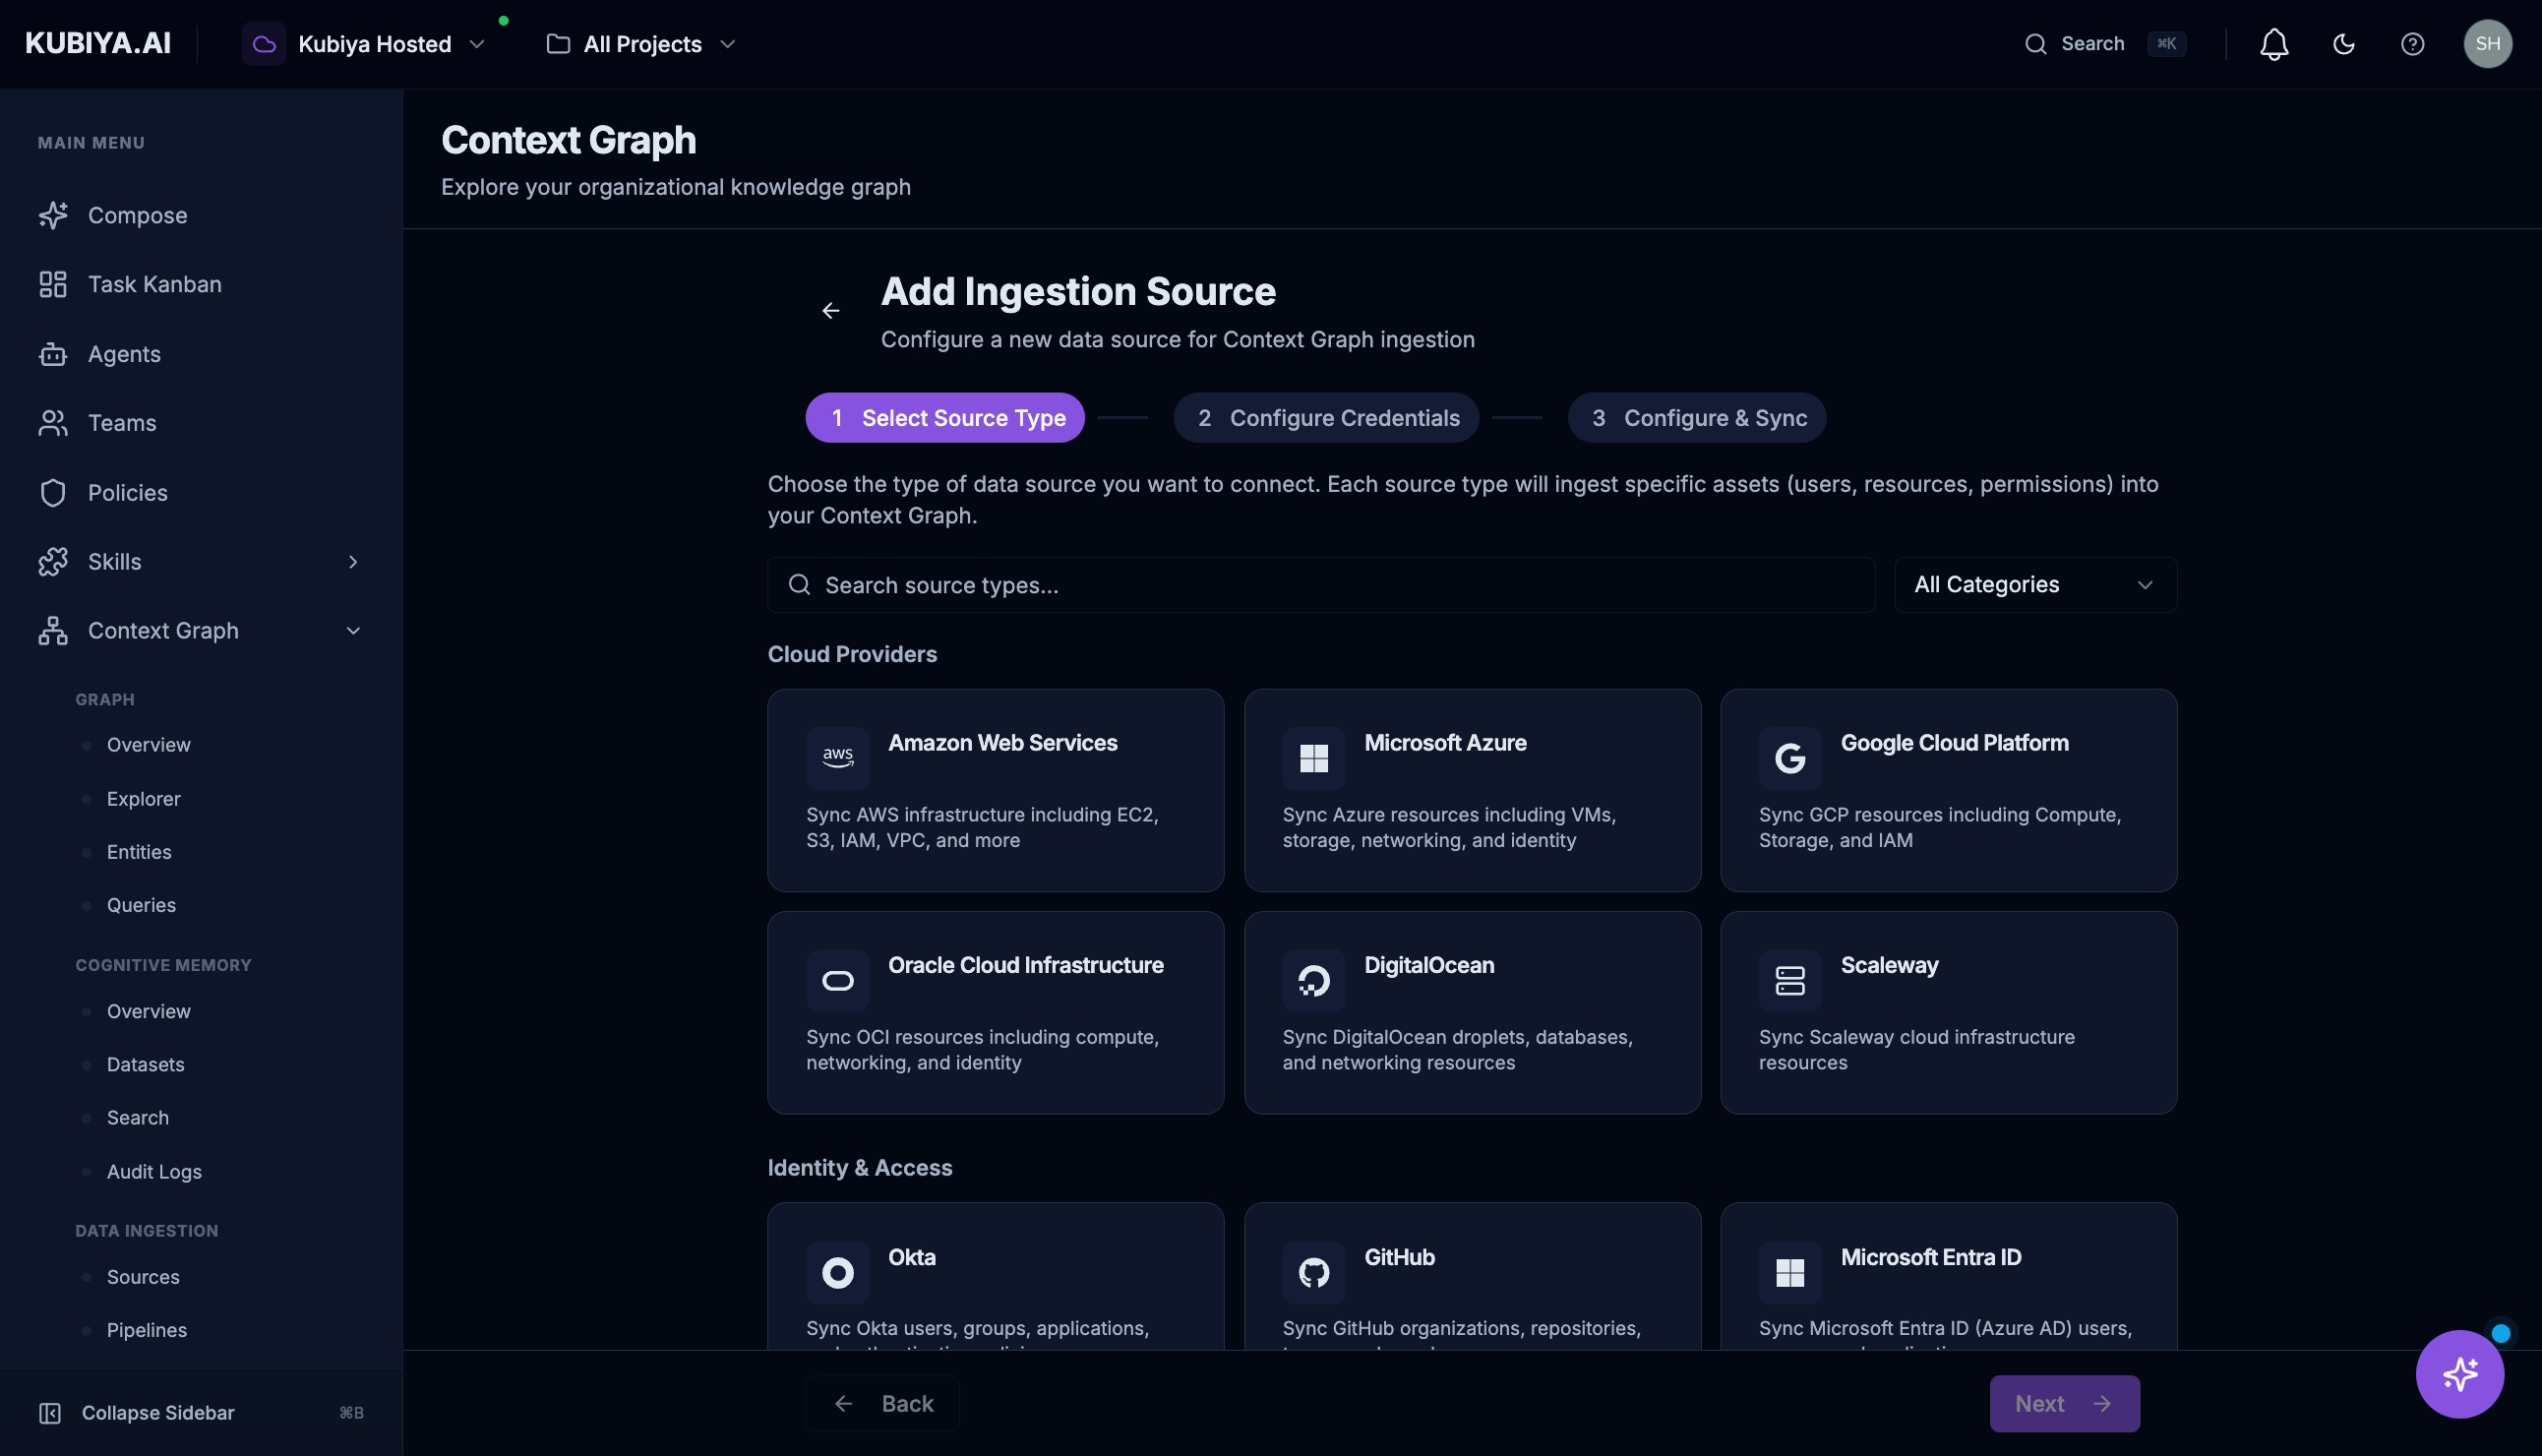 Choose from available categories:
* **Cloud Providers**: AWS, Azure, GCP, Oracle Cloud, DigitalOcean, Scaleway
* **Identity & Access**: Okta, Microsoft Entra ID, Google Workspace, Keycloak
* **DevOps**: Kubernetes, GitHub, CircleCI, Spacelift, Cloudflare, Tailscale
* **Security**: CrowdStrike, SentinelOne, Trivy, CVE Database, PagerDuty
* **Administration**: Jamf, Kandji, Snipe-IT, Anthropic, OpenAI
**Step 2: Configure Credentials**
Choose from available categories:
* **Cloud Providers**: AWS, Azure, GCP, Oracle Cloud, DigitalOcean, Scaleway
* **Identity & Access**: Okta, Microsoft Entra ID, Google Workspace, Keycloak
* **DevOps**: Kubernetes, GitHub, CircleCI, Spacelift, Cloudflare, Tailscale
* **Security**: CrowdStrike, SentinelOne, Trivy, CVE Database, PagerDuty
* **Administration**: Jamf, Kandji, Snipe-IT, Anthropic, OpenAI
**Step 2: Configure Credentials**
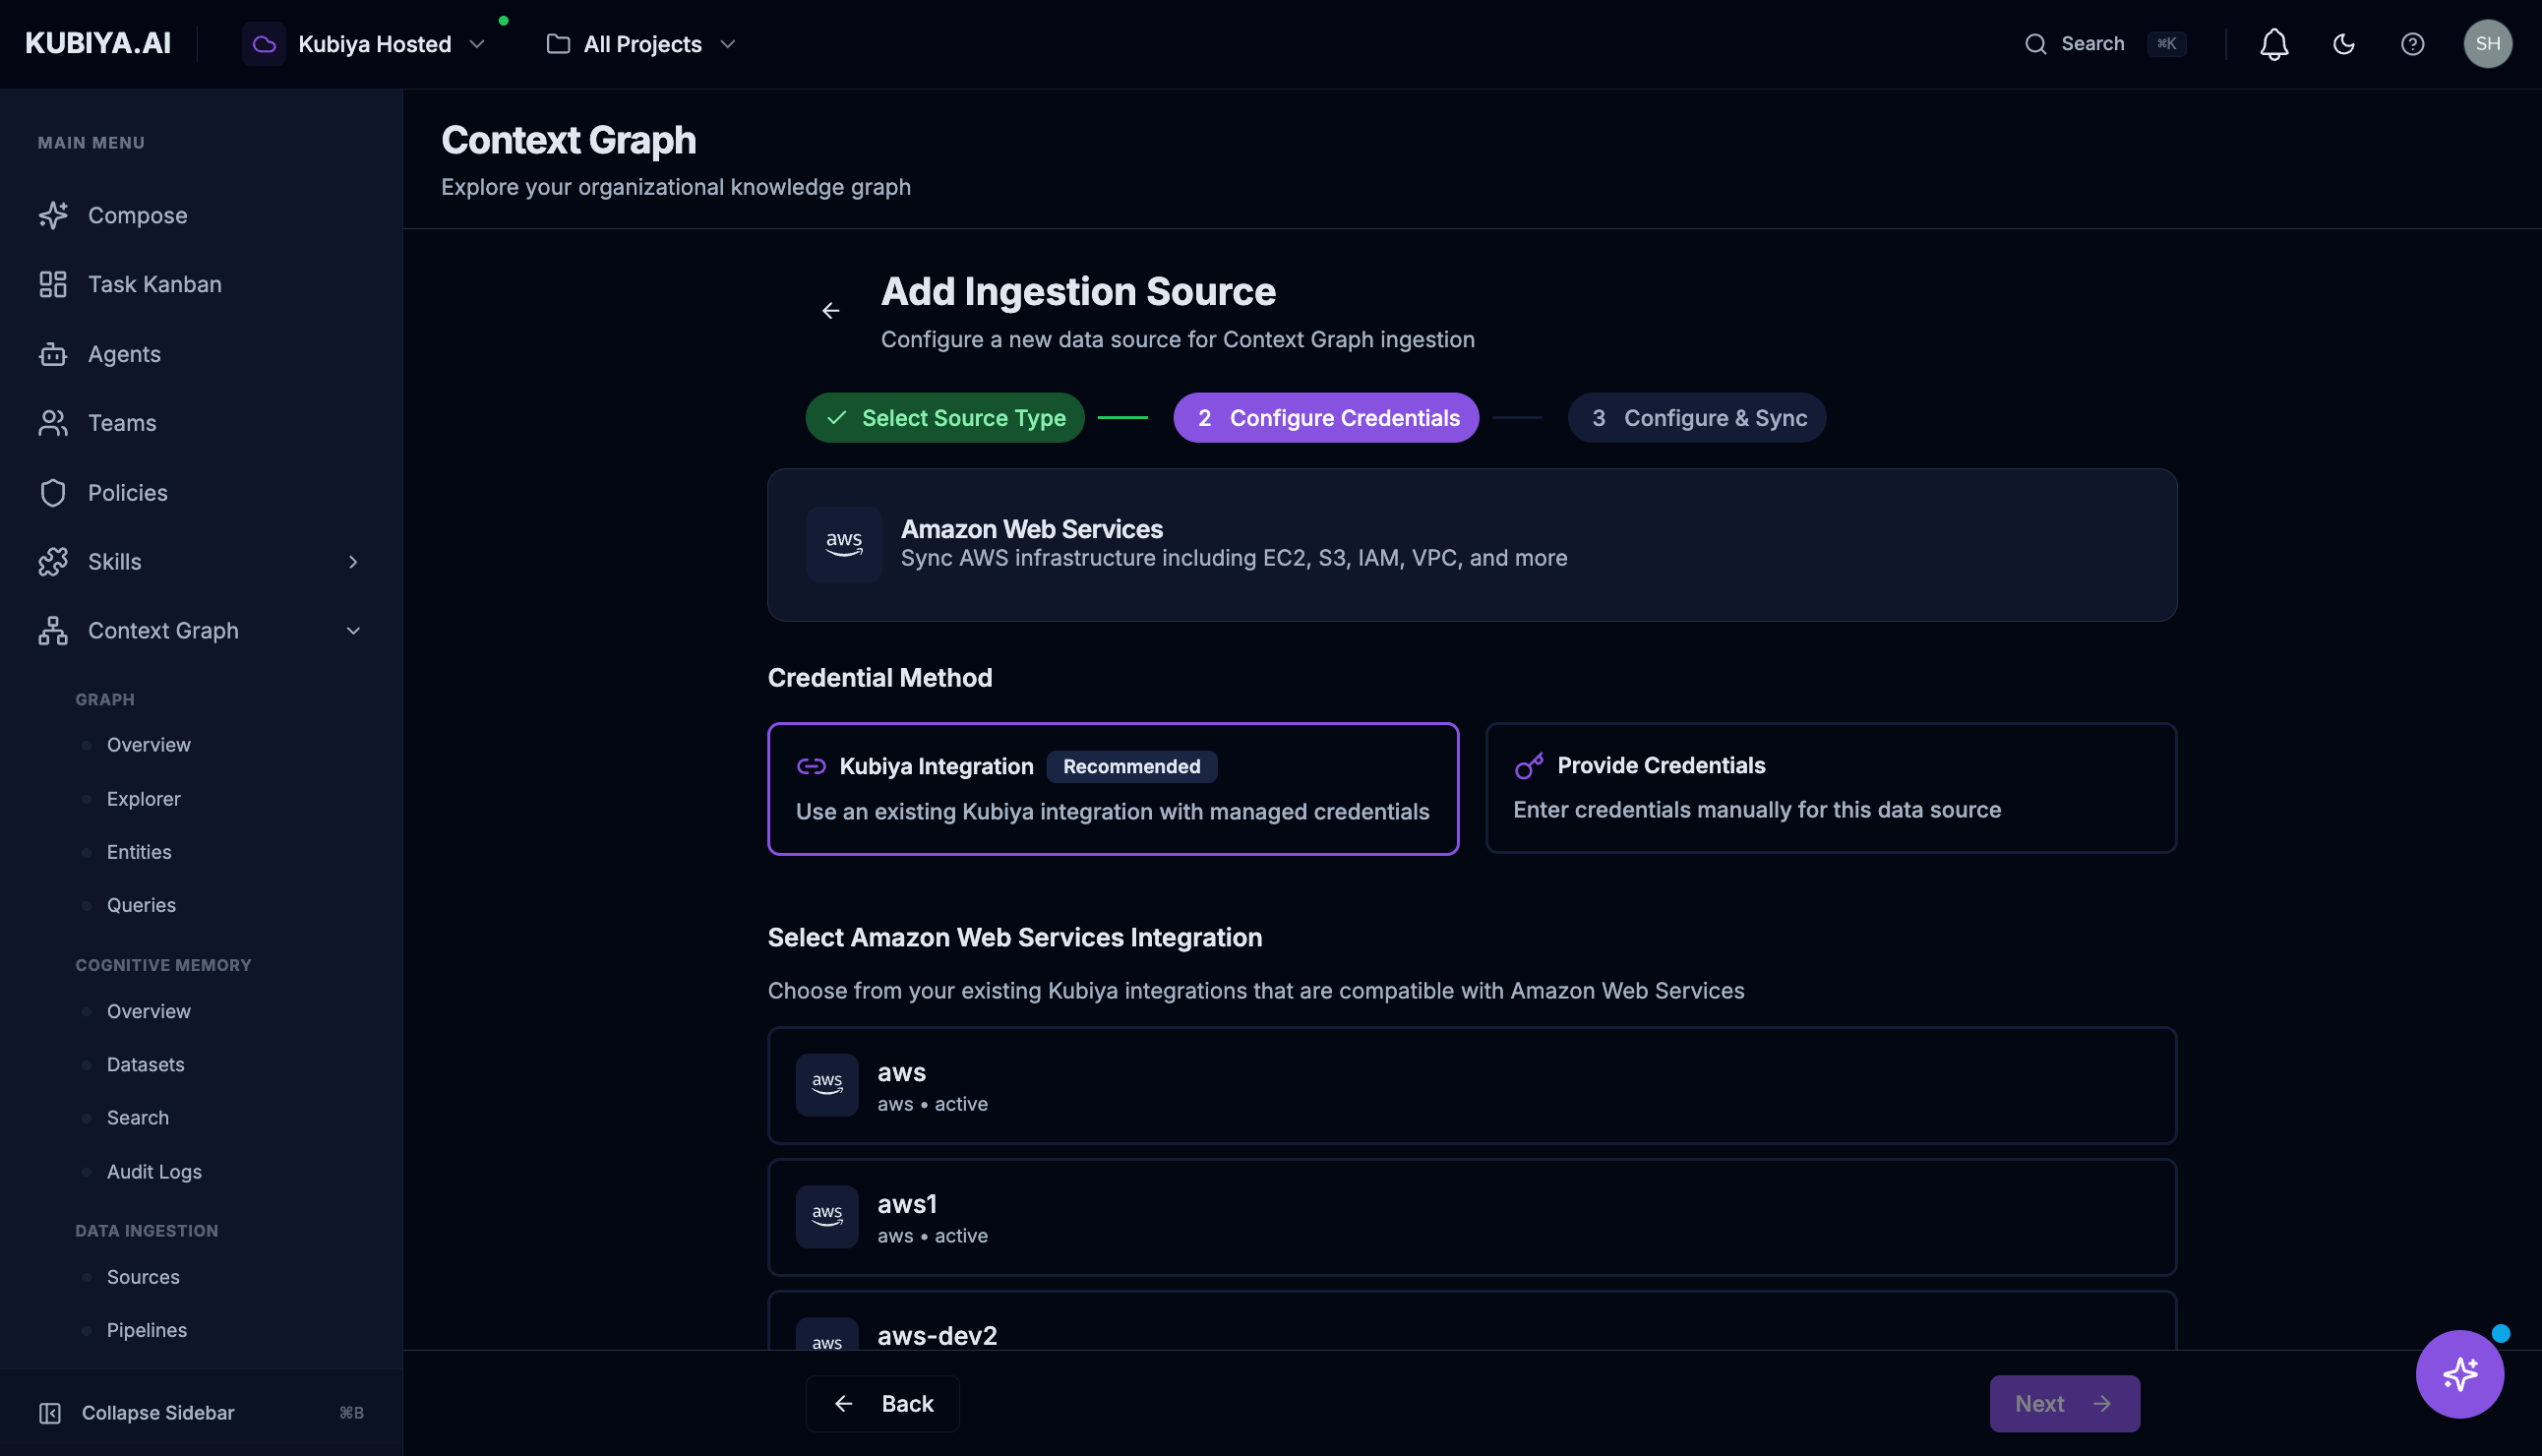 Choose your authentication method:
* **Kubiya Integration** (Recommended): Use an existing connector with managed credentials
* **Provide Credentials**: Enter API keys, OAuth tokens, or service account credentials manually
**Step 3: Configure & Sync**
Choose your authentication method:
* **Kubiya Integration** (Recommended): Use an existing connector with managed credentials
* **Provide Credentials**: Enter API keys, OAuth tokens, or service account credentials manually
**Step 3: Configure & Sync**
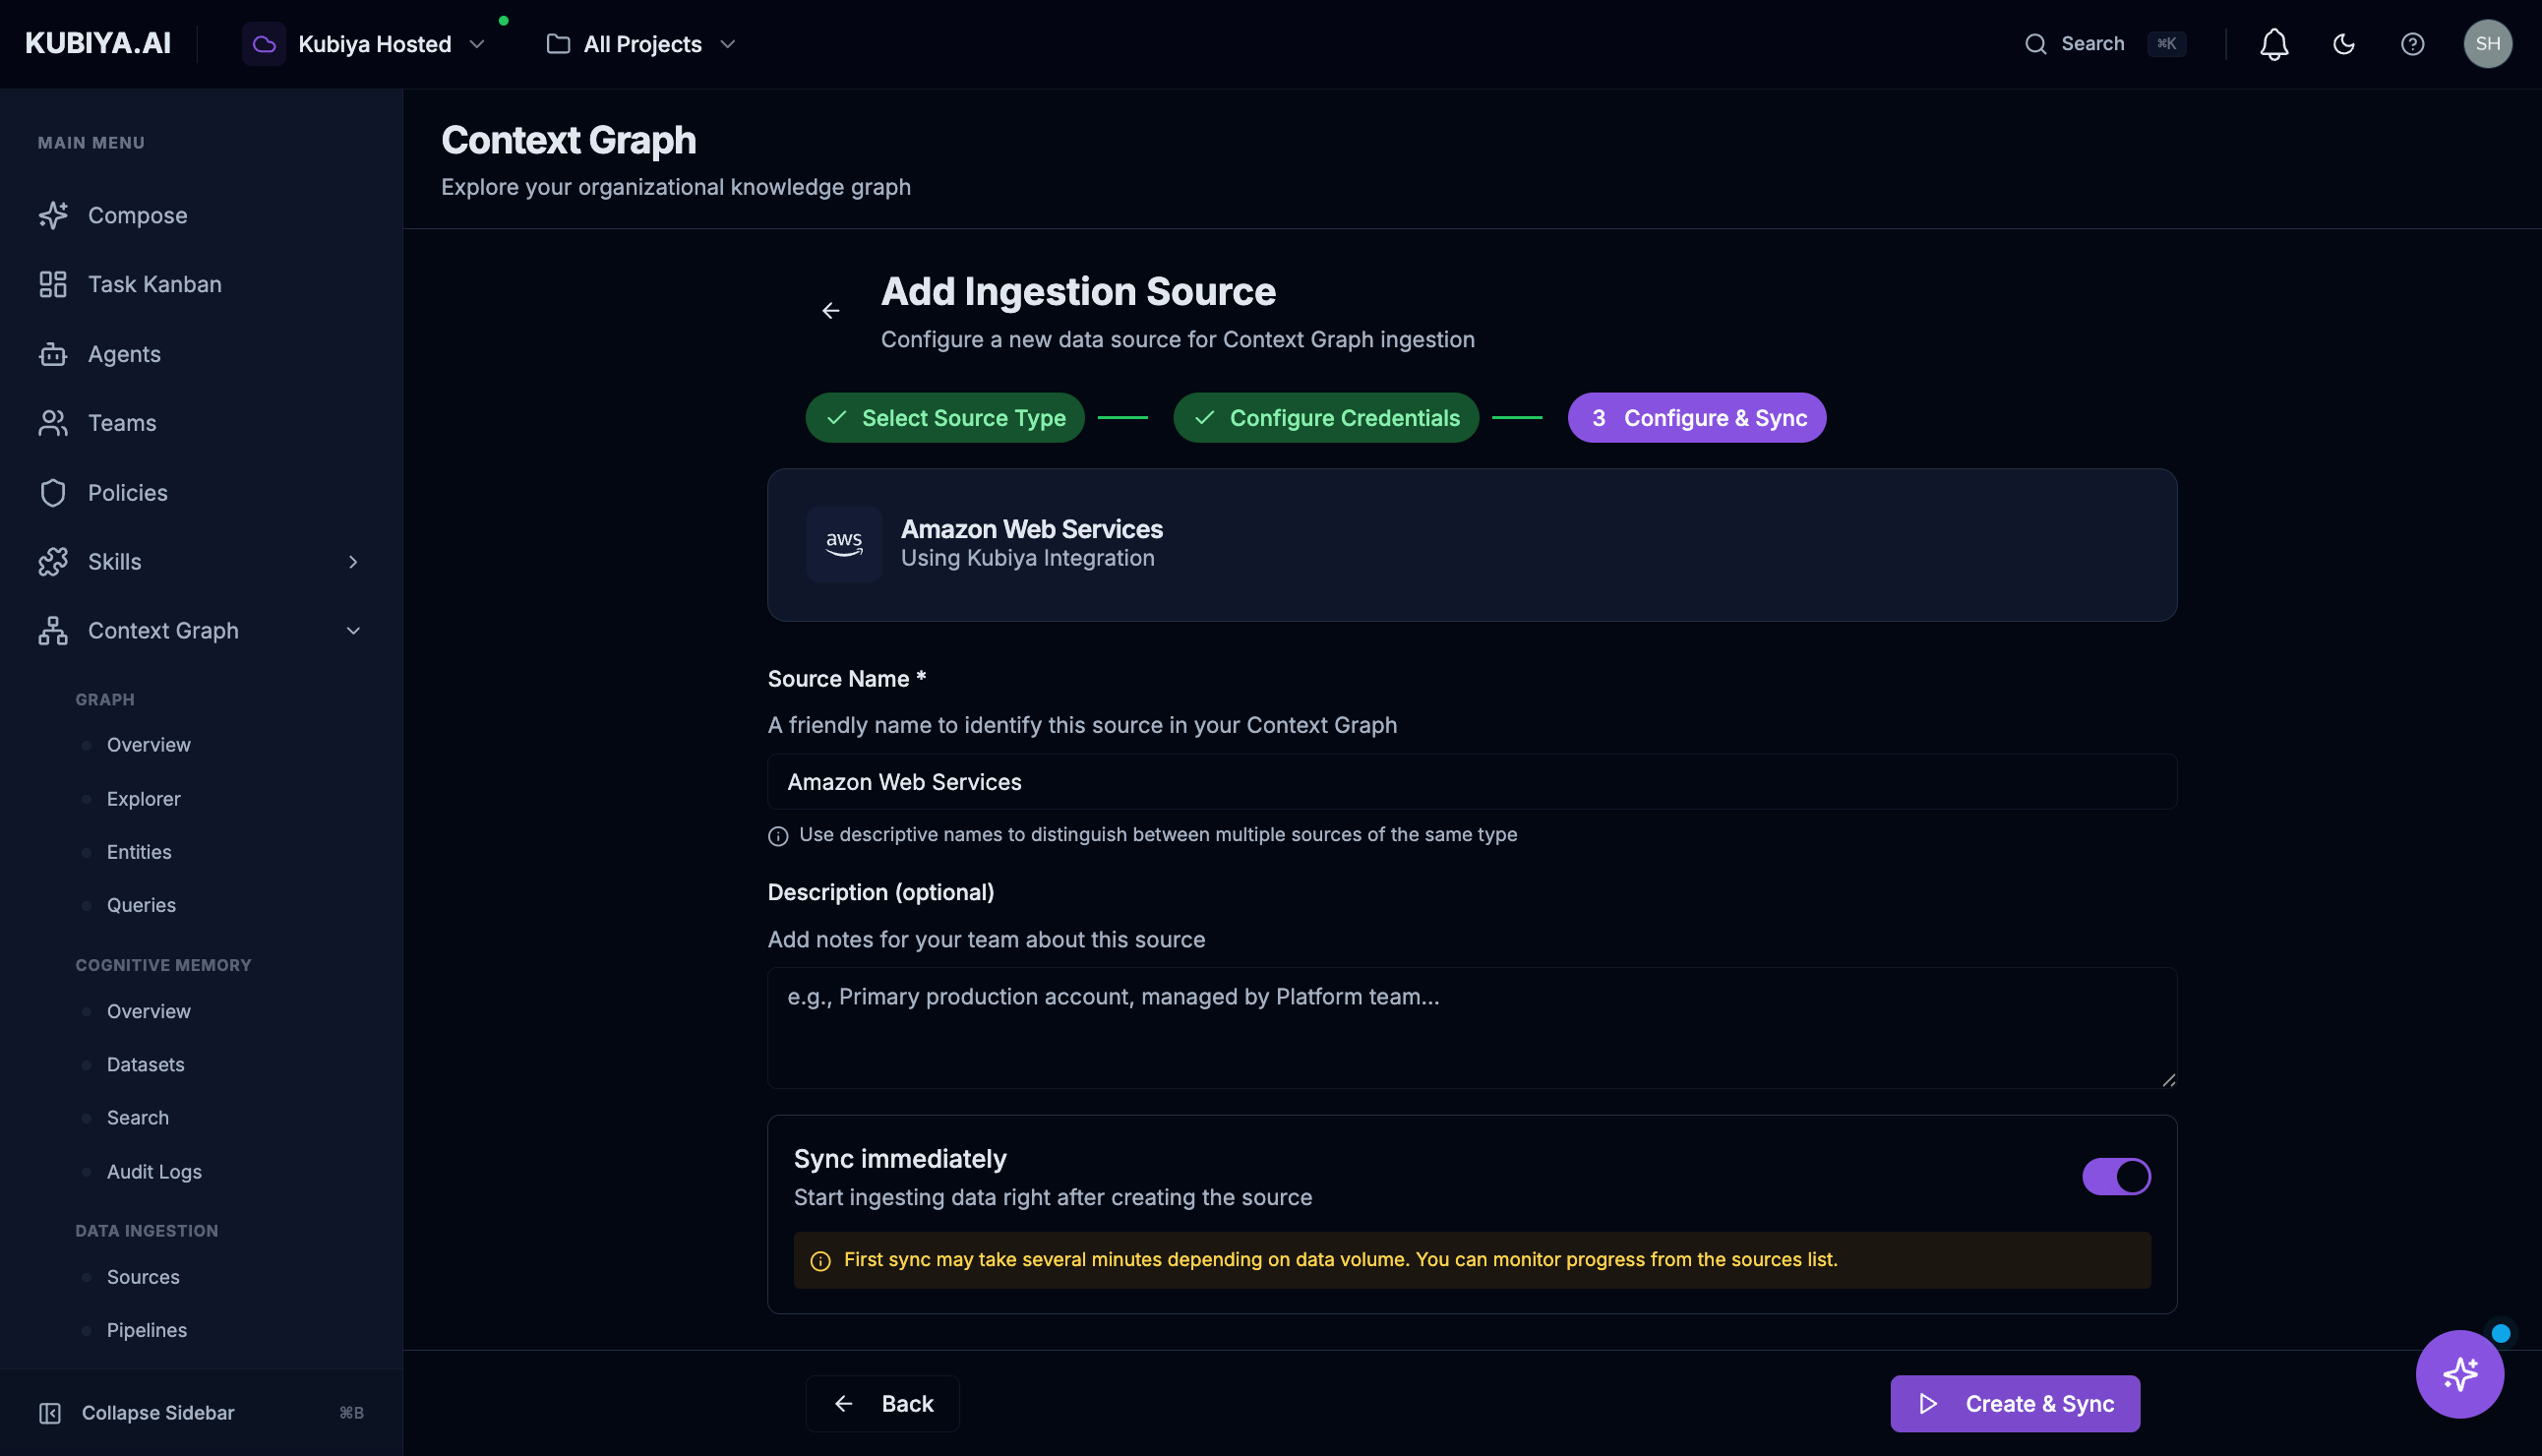 * **Source Name**: A friendly identifier for this source
* **Description**: Optional notes for your team
* **Sync Immediately**: Start ingesting data right away
Click **Create & Sync** to complete setup.
***
## **Pipelines**
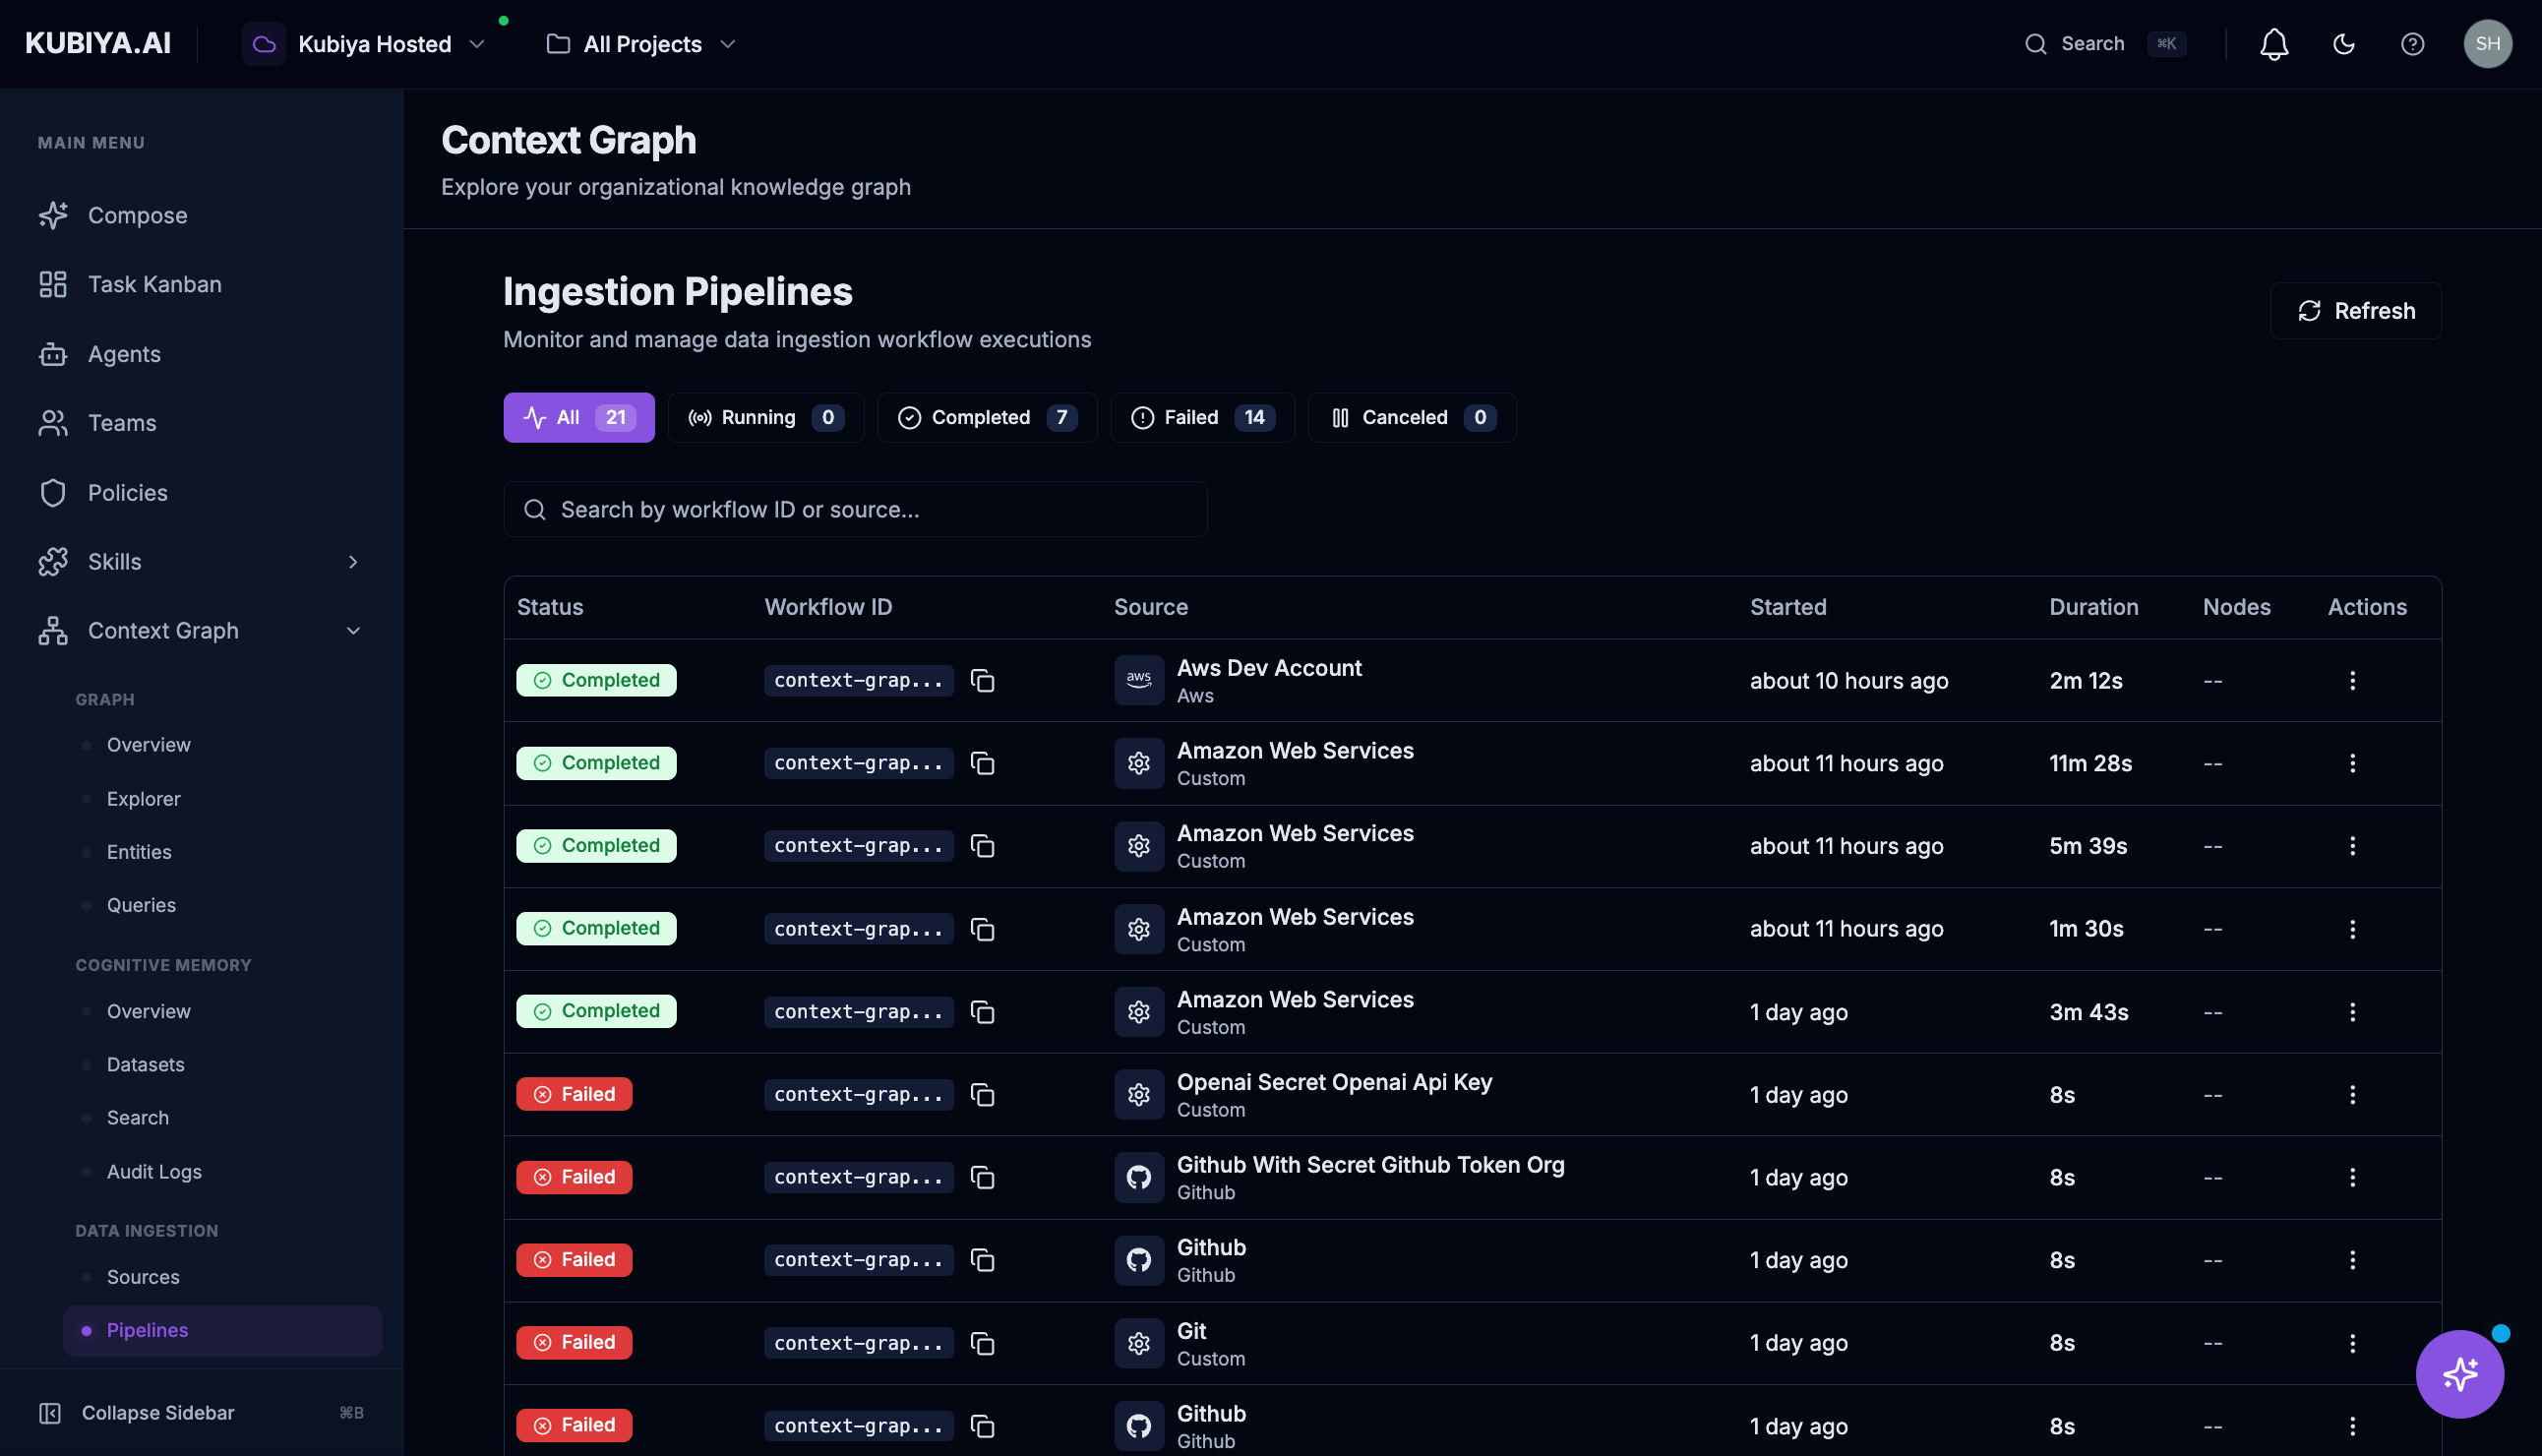
The Pipelines page shows all ingestion workflow executions.
* **Source Name**: A friendly identifier for this source
* **Description**: Optional notes for your team
* **Sync Immediately**: Start ingesting data right away
Click **Create & Sync** to complete setup.
***
## **Pipelines**
The Pipelines page shows all ingestion workflow executions.
 ### **Pipeline Information**
| Column | Description |
| --------------- | --------------------------------------- |
| **Status** | Completed, Running, Failed, or Canceled |
| **Workflow ID** | Unique identifier for the pipeline run |
| **Source** | The data source being synced |
| **Started** | When the pipeline began |
| **Duration** | How long the sync took |
| **Nodes** | Number of entities processed |
### **Filtering Pipelines**
Use the status filters to quickly find:
* **All**: View all pipeline runs
* **Running**: Currently active syncs
* **Completed**: Successful syncs
* **Failed**: Syncs that encountered errors
* **Canceled**: Manually stopped syncs
### **Troubleshooting Failed Pipelines**
1. Click on a failed pipeline to view details
2. Check the error message for specifics
3. Common issues:
* **Expired credentials**: Re-authenticate the source
* **Permission denied**: Update IAM roles or access tokens
* **Rate limiting**: Wait and retry, or adjust sync frequency
* **Network errors**: Check connectivity to the source
***
## **Activity**
The Activity page provides a historical timeline of all ingestion events.
### **Pipeline Information**
| Column | Description |
| --------------- | --------------------------------------- |
| **Status** | Completed, Running, Failed, or Canceled |
| **Workflow ID** | Unique identifier for the pipeline run |
| **Source** | The data source being synced |
| **Started** | When the pipeline began |
| **Duration** | How long the sync took |
| **Nodes** | Number of entities processed |
### **Filtering Pipelines**
Use the status filters to quickly find:
* **All**: View all pipeline runs
* **Running**: Currently active syncs
* **Completed**: Successful syncs
* **Failed**: Syncs that encountered errors
* **Canceled**: Manually stopped syncs
### **Troubleshooting Failed Pipelines**
1. Click on a failed pipeline to view details
2. Check the error message for specifics
3. Common issues:
* **Expired credentials**: Re-authenticate the source
* **Permission denied**: Update IAM roles or access tokens
* **Rate limiting**: Wait and retry, or adjust sync frequency
* **Network errors**: Check connectivity to the source
***
## **Activity**
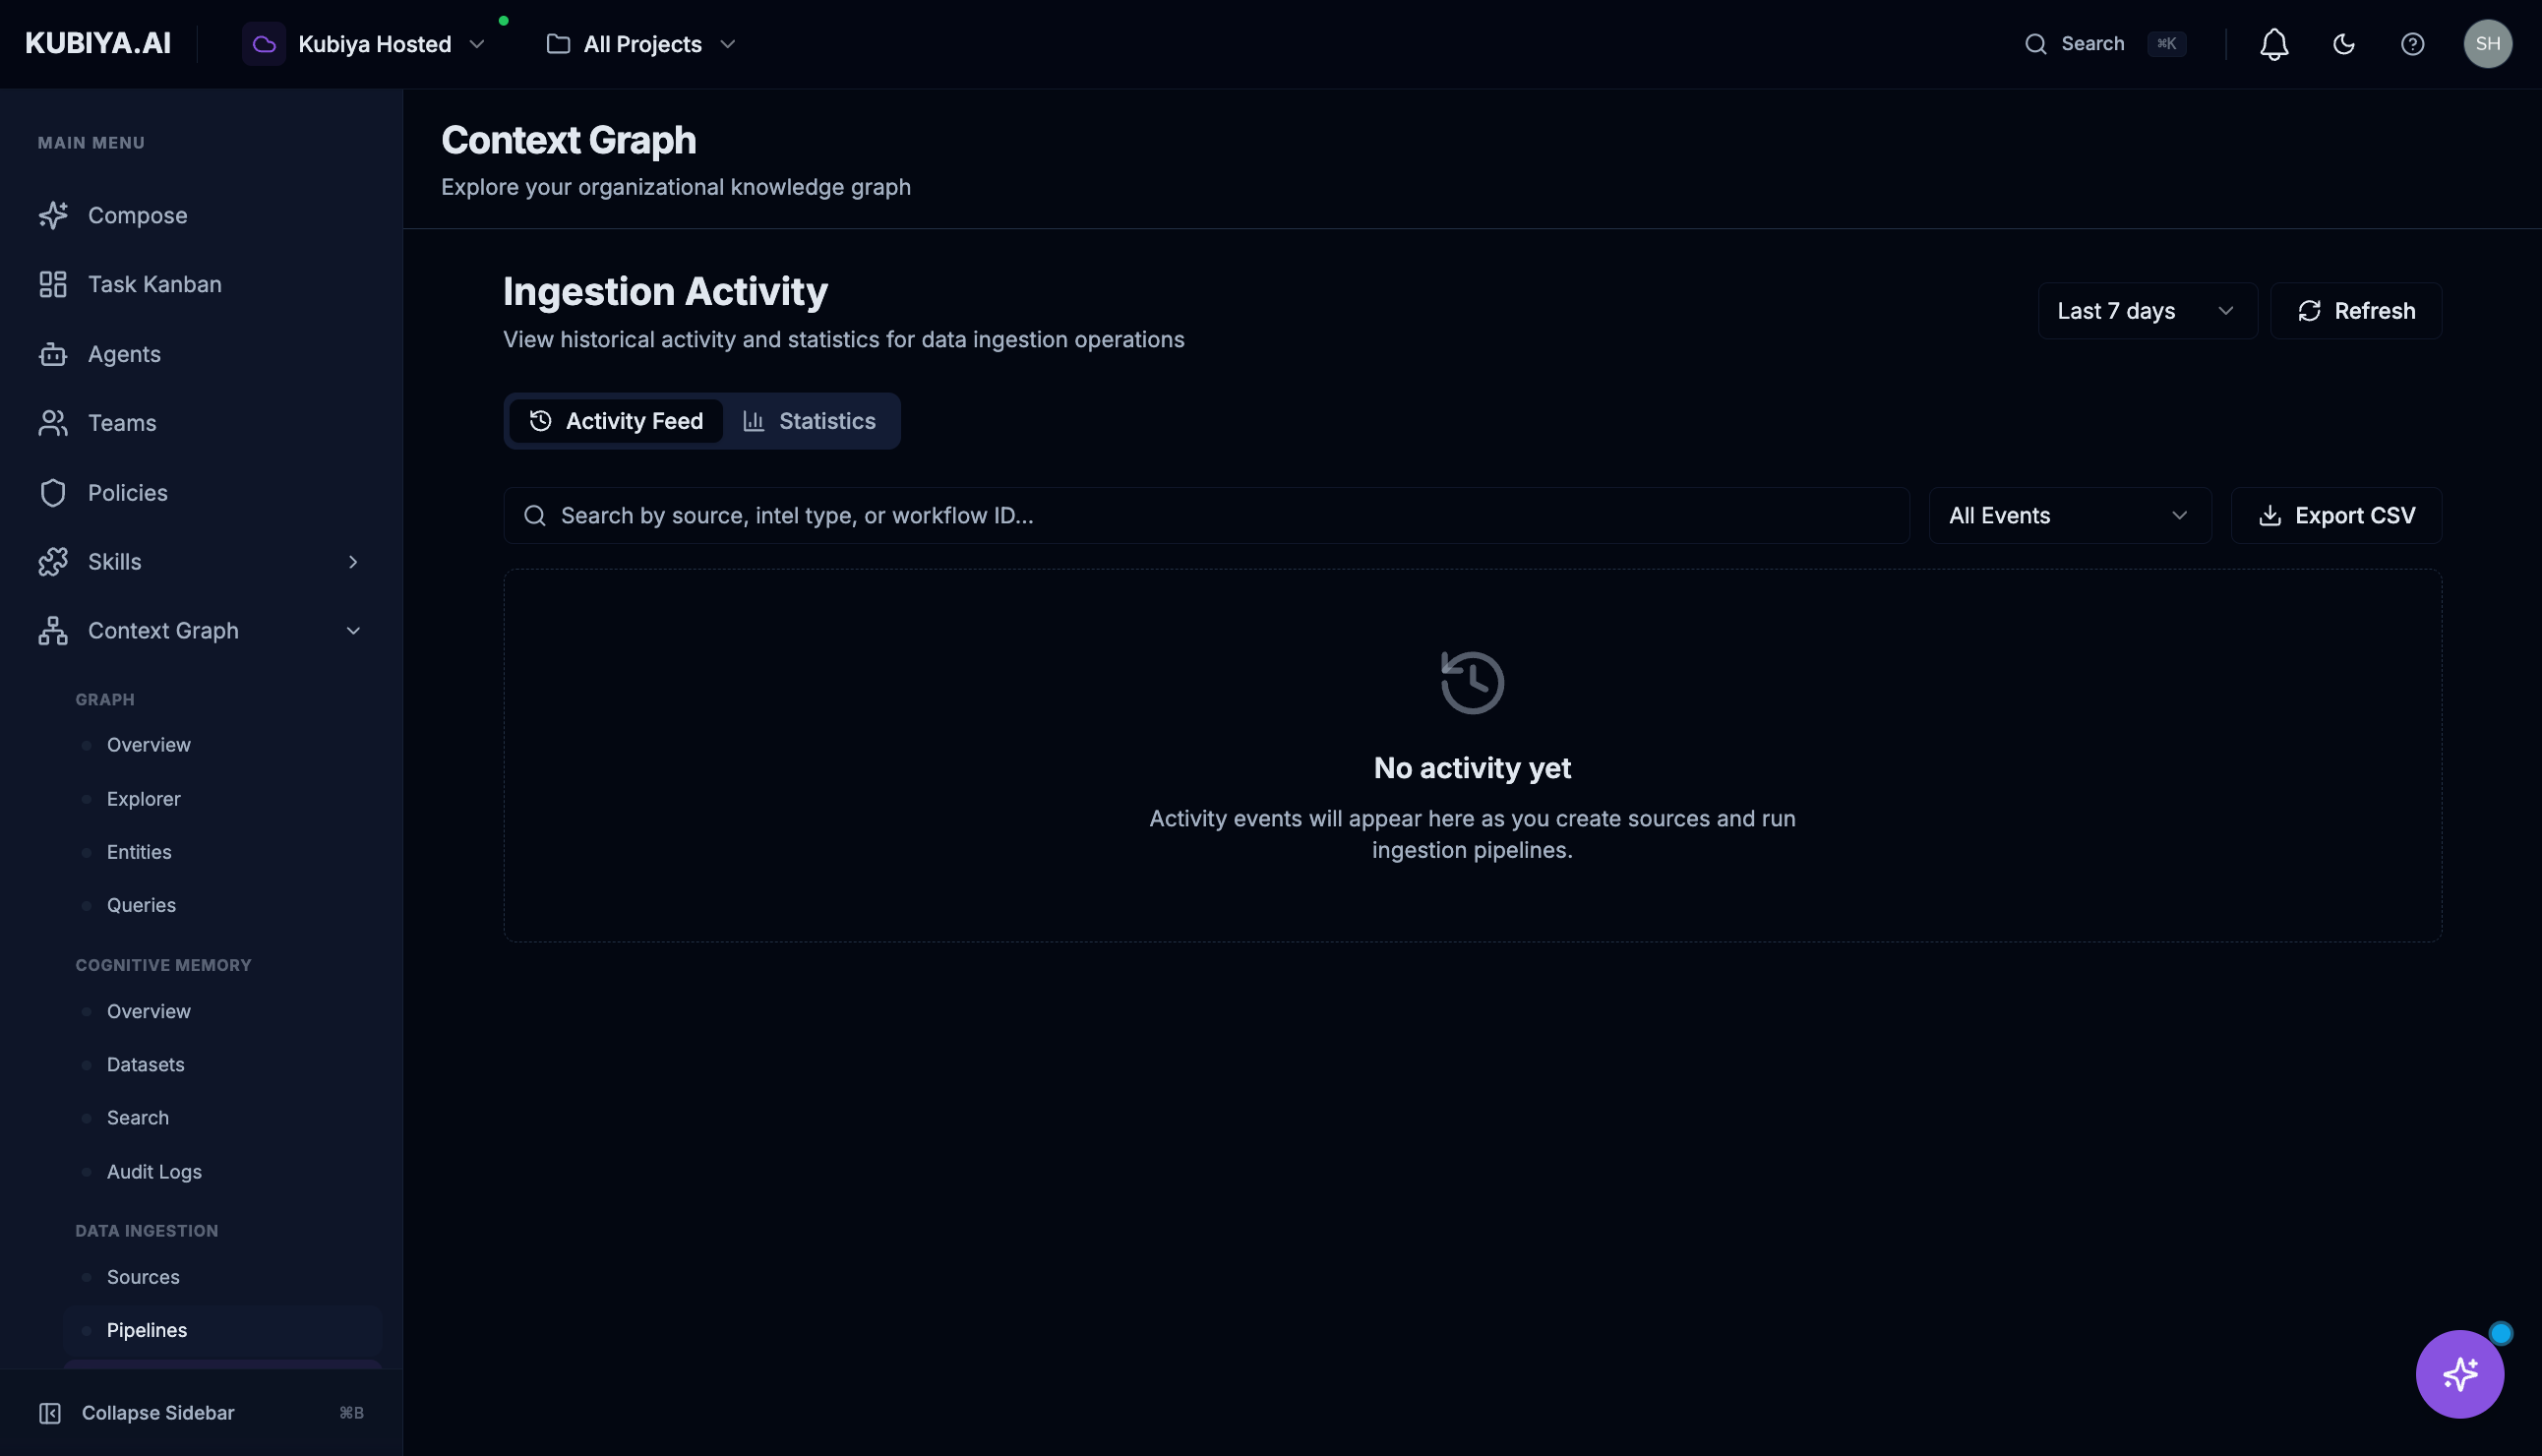
The Activity page provides a historical timeline of all ingestion events.
 ### **Activity Feed**
View chronological events including:
* Sync starts and completions
* Entity creation and updates
* Errors and warnings
* Manual triggers
### **Statistics**
Switch to the Statistics tab for aggregated metrics:
* Total syncs over time
* Success/failure rates
* Entity counts by source
### **Filtering**
* **Time Range**: Last 7 days, 30 days, or custom
* **Event Type**: All events or specific types
* **Export CSV**: Download activity data for analysis
***
## **Using Ingested Data with Meta Agent**
After successful data ingestion, use the [Meta Agent](/core-concepts/meta-agent) to explore your infrastructure through natural language:
### **Example Queries**
Ask the Meta Agent questions about your ingested data:
```
"What AWS resources were ingested?"
```
```
"Show me all EC2 instances in production"
```
```
"Which IAM roles have admin access?"
```
```
"What services depend on the auth database?"
```
```
"List all GitHub repositories with their team owners"
```
The Meta Agent queries the Context Graph and returns structured insights, helping you understand your infrastructure without writing queries.
**Pro tip**: After adding a new ingestion source, ask the Meta Agent "What new entities were added from \[source name]?" to verify the data was ingested correctly.
***
## **Troubleshooting**
### **Source Shows Error Status**
1. Check the Pipelines page for detailed error messages
2. Verify credentials haven't expired
3. Confirm permissions are correct for the source platform
4. Check for network connectivity issues
### **Low Success Rate**
1. Review failed pipeline runs for specific errors
2. Check if certain resource types are failing consistently
3. Verify the source configuration matches the current platform state
### **Data Not Appearing**
1. Confirm the source status is **Active**
2. Check that a sync has completed (not still running)
3. Verify the sync schedule isn't too infrequent
4. Try triggering a manual sync
### **Stale Data**
1. Check when the last successful sync occurred
2. Trigger a manual sync to refresh data
3. Consider adjusting the sync schedule for more frequent updates
***
## **Best Practices**
1. **Start with one source** - Verify ingestion works before adding more
2. **Use read-only credentials** - Kubiya only needs read access for ingestion
3. **Monitor pipelines regularly** - Catch sync issues early
4. **Set appropriate schedules** - Balance data freshness with API rate limits
5. **Use Kubiya Integrations** - Managed credentials are easier to maintain
***
## **What's Next**
Explore ingested data through natural language
Visualize relationships and dependencies
Browse and search ingested entities
Enable agents to act on your infrastructure
### **Activity Feed**
View chronological events including:
* Sync starts and completions
* Entity creation and updates
* Errors and warnings
* Manual triggers
### **Statistics**
Switch to the Statistics tab for aggregated metrics:
* Total syncs over time
* Success/failure rates
* Entity counts by source
### **Filtering**
* **Time Range**: Last 7 days, 30 days, or custom
* **Event Type**: All events or specific types
* **Export CSV**: Download activity data for analysis
***
## **Using Ingested Data with Meta Agent**
After successful data ingestion, use the [Meta Agent](/core-concepts/meta-agent) to explore your infrastructure through natural language:
### **Example Queries**
Ask the Meta Agent questions about your ingested data:
```
"What AWS resources were ingested?"
```
```
"Show me all EC2 instances in production"
```
```
"Which IAM roles have admin access?"
```
```
"What services depend on the auth database?"
```
```
"List all GitHub repositories with their team owners"
```
The Meta Agent queries the Context Graph and returns structured insights, helping you understand your infrastructure without writing queries.
**Pro tip**: After adding a new ingestion source, ask the Meta Agent "What new entities were added from \[source name]?" to verify the data was ingested correctly.
***
## **Troubleshooting**
### **Source Shows Error Status**
1. Check the Pipelines page for detailed error messages
2. Verify credentials haven't expired
3. Confirm permissions are correct for the source platform
4. Check for network connectivity issues
### **Low Success Rate**
1. Review failed pipeline runs for specific errors
2. Check if certain resource types are failing consistently
3. Verify the source configuration matches the current platform state
### **Data Not Appearing**
1. Confirm the source status is **Active**
2. Check that a sync has completed (not still running)
3. Verify the sync schedule isn't too infrequent
4. Try triggering a manual sync
### **Stale Data**
1. Check when the last successful sync occurred
2. Trigger a manual sync to refresh data
3. Consider adjusting the sync schedule for more frequent updates
***
## **Best Practices**
1. **Start with one source** - Verify ingestion works before adding more
2. **Use read-only credentials** - Kubiya only needs read access for ingestion
3. **Monitor pipelines regularly** - Catch sync issues early
4. **Set appropriate schedules** - Balance data freshness with API rate limits
5. **Use Kubiya Integrations** - Managed credentials are easier to maintain
***
## **What's Next**
Explore ingested data through natural language
Visualize relationships and dependencies
Browse and search ingested entities
Enable agents to act on your infrastructure