> ## Documentation Index
> Fetch the complete documentation index at: https://docs.kubiya.ai/llms.txt
> Use this file to discover all available pages before exploring further.
# Custom Dashboards
> Create and manage tailored analytics dashboards with summary cards, widget counts, and quick actions. Monitor key metrics and organize views for executives, cost analysis, and performance tracking.
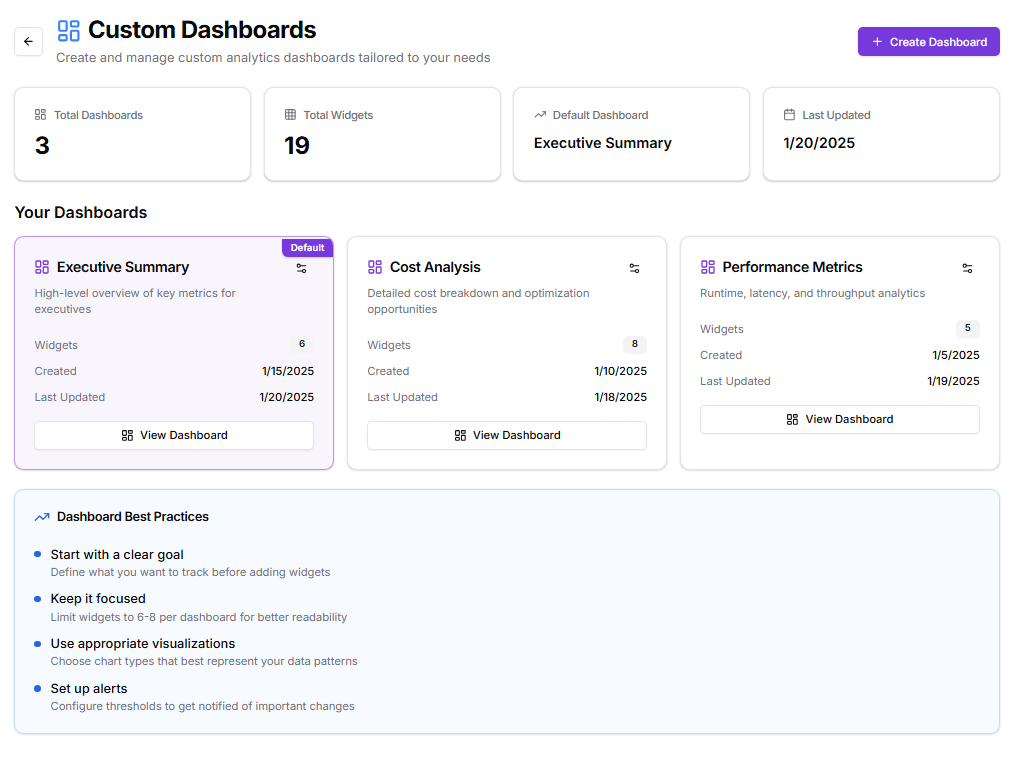 The **Custom Dashboards** page allows users to create and manage analytics dashboards that are customized to their specific reporting or monitoring needs. It provides an organized overview of all dashboards in the account, their key details, and quick actions to view or create new dashboards.
### **Key Functional Sections**
#### **Summary Cards**
Four summary cards provide an at-a-glance view of overall dashboard statistics:
* **Total Dashboards** – Displays the total number of dashboards currently created.
* **Total Widgets** – Shows the cumulative count of all widgets across dashboards.
* **Default Dashboard** – Indicates which dashboard is currently set as the default.
* **Last Updated** – Shows the most recent modification date among all dashboards.
In the provided view, there are three dashboards with a total of nineteen widgets. The **Executive Summary** dashboard is set as the default and was last updated on **1/20/2025**.
#### **Dashboard List**
Below the summary cards, the **Your Dashboards** section displays individual dashboard cards. Each card contains:
* Dashboard **name** and a short **description**.
* **Number of widgets** within the dashboard.
* **Creation** and **last updated** dates.
* A **View Dashboard** button for direct navigation.
* The **Default** badge, where applicable, to mark the primary dashboard.
Example dashboards displayed:
1. **Executive Summary** – A high-level overview of key metrics relevant to executives.
* Widgets: 6
* Created: 1/15/2025
* Last Updated: 1/20/2025
2. **Cost Analysis** – Provides a detailed breakdown of costs and identifies optimization opportunities.
* Widgets: 8
* Created: 1/10/2025
* Last Updated: 1/18/2025
3. **Performance Metrics** – Tracks runtime, latency, and throughput analytics for operational performance.
* Widgets: 5
* Created: 1/5/2025
* Last Updated: 1/19/2025
#### **Dashboard Best Practices**
A guidance panel titled **Dashboard Best Practices** is included at the bottom of the page. It offers practical tips to help users design efficient and meaningful dashboards:
* **Start with a clear goal** – Define what data or KPIs you intend to monitor before adding widgets.
* **Keep it focused** – Maintain clarity by limiting each dashboard to six to eight widgets for better readability.
* **Use appropriate visualizations** – Choose chart or widget types that best represent the underlying data trends.
* **Set up alerts** – Configure thresholds to receive notifications for significant changes or anomalies.
The **Custom Dashboards** page allows users to create and manage analytics dashboards that are customized to their specific reporting or monitoring needs. It provides an organized overview of all dashboards in the account, their key details, and quick actions to view or create new dashboards.
### **Key Functional Sections**
#### **Summary Cards**
Four summary cards provide an at-a-glance view of overall dashboard statistics:
* **Total Dashboards** – Displays the total number of dashboards currently created.
* **Total Widgets** – Shows the cumulative count of all widgets across dashboards.
* **Default Dashboard** – Indicates which dashboard is currently set as the default.
* **Last Updated** – Shows the most recent modification date among all dashboards.
In the provided view, there are three dashboards with a total of nineteen widgets. The **Executive Summary** dashboard is set as the default and was last updated on **1/20/2025**.
#### **Dashboard List**
Below the summary cards, the **Your Dashboards** section displays individual dashboard cards. Each card contains:
* Dashboard **name** and a short **description**.
* **Number of widgets** within the dashboard.
* **Creation** and **last updated** dates.
* A **View Dashboard** button for direct navigation.
* The **Default** badge, where applicable, to mark the primary dashboard.
Example dashboards displayed:
1. **Executive Summary** – A high-level overview of key metrics relevant to executives.
* Widgets: 6
* Created: 1/15/2025
* Last Updated: 1/20/2025
2. **Cost Analysis** – Provides a detailed breakdown of costs and identifies optimization opportunities.
* Widgets: 8
* Created: 1/10/2025
* Last Updated: 1/18/2025
3. **Performance Metrics** – Tracks runtime, latency, and throughput analytics for operational performance.
* Widgets: 5
* Created: 1/5/2025
* Last Updated: 1/19/2025
#### **Dashboard Best Practices**
A guidance panel titled **Dashboard Best Practices** is included at the bottom of the page. It offers practical tips to help users design efficient and meaningful dashboards:
* **Start with a clear goal** – Define what data or KPIs you intend to monitor before adding widgets.
* **Keep it focused** – Maintain clarity by limiting each dashboard to six to eight widgets for better readability.
* **Use appropriate visualizations** – Choose chart or widget types that best represent the underlying data trends.
* **Set up alerts** – Configure thresholds to receive notifications for significant changes or anomalies.