> ## Documentation Index
> Fetch the complete documentation index at: https://docs.kubiya.ai/llms.txt
> Use this file to discover all available pages before exploring further.
# Worker Management
> Deploy and manage Temporal-based execution workers on your infrastructure
Kubiya Workers are Temporal-based execution engines that process AI agent workflows with enterprise-grade reliability and scalability.
**Run on Any Compute Environment**: Workers can run on nearly any infrastructure - your local machine (Mac, Linux, Windows), Kubernetes clusters, Docker containers, VMs (EC2, GCE, Azure), or bare metal servers. This flexibility makes them incredibly powerful and easy to deploy wherever your infrastructure lives!
This guide covers worker deployment, configuration, and management.
## What is a Worker?
Workers are distributed execution engines that:
* **Poll Task Queues**: Listen for workflow and activity tasks from Temporal
* **Execute Agent Workflows**: Run AI agents with tools and integrations
* **Report Health**: Send heartbeats to the Control Plane
* **Stream Events**: Provide real-time execution updates
* **Handle Failures**: Automatically retry failed tasks with exponential backoff
```mermaid theme={null}
sequenceDiagram
participant CLI as CLI
participant CP as Control Plane
participant T as Temporal Cloud
participant W as Worker
participant Agent as AI Agent
CLI->>W: Start Worker
W->>CP: Register & Get Config
CP->>W: Temporal Credentials
W->>T: Connect & Poll
loop Task Execution
T->>W: Workflow Task
W->>Agent: Initialize & Execute
Agent->>CP: Stream Events
Agent->>W: Complete
W->>T: Update Status
end
loop Every 30s
W->>CP: Heartbeat
CP->>W: ACK
end
```
## Quick Start
### Start Your First Worker
```bash theme={null}
# 1. Configure API Key
export KUBIYA_API_KEY="your-api-key"
# 2. Start a local worker
kubiya worker start --queue-id=my-queue --type=local
# 3. Monitor logs (in another terminal)
tail -f ~/.kubiya/workers/my-queue/logs/worker.log
```
### Deployment Modes
Development and testing with Python virtual environment
Production deployment running as background process
Containerized deployment with isolation
Scalable multi-replica deployment with auto-scaling
## Ephemeral vs Persistent Workers
Kubiya supports two worker lifecycle models to match different use cases:
### Ephemeral Workers
**Perfect for CI/CD pipelines and single-task automation**
Ephemeral workers are automatically provisioned to execute a single task and then terminate. They're ideal for:
Automatically execute deployment tasks in GitHub Actions, GitLab CI, Jenkins without managing infrastructure
Run one-off automation tasks triggered by webhooks, cron jobs, or API calls
Test agent workflows locally without setting up persistent infrastructure
Pay only for actual execution time - no idle workers consuming resources
**How Ephemeral Workers Work:**
```bash theme={null}
# Option 1: On-Demand Workers (Kubiya Cloud)
kubiya exec "Deploy my app to production"
# Control Plane provisions worker → Executes task → Auto-cleanup
# Option 2: Local Ephemeral Workers
kubiya exec --local "Run integration tests" --yes
# CLI creates temp queue → Starts local worker → Executes → Cleanup
```
**Key Benefits:**
* ✅ **Zero Infrastructure Management**: No need to pre-provision or maintain workers
* ✅ **Automatic Cleanup**: Workers and queues are automatically removed after execution
* ✅ **Perfect for CI/CD**: Integrate directly into pipelines without worker setup
* ✅ **Cost-Effective**: Only runs when needed, no idle resource costs
* ✅ **Isolated Execution**: Each task gets a fresh, clean worker environment
**Use Ephemeral Workers When:**
* Running tasks in CI/CD pipelines
* Executing occasional automation workflows
* Testing and development
* One-off operations that don't require persistent infrastructure
### Persistent Workers
**Best for high-frequency tasks and production workloads**
Persistent workers run continuously, polling for tasks 24/7. They're ideal for:
* **High-Frequency Operations**: Responding to frequent execution requests with low latency
* **Real-Time Monitoring**: Continuously processing alerts and monitoring tasks
* **Custom Infrastructure**: Running on your specific infrastructure with custom network access
* **Stateful Workflows**: Maintaining connection pools, caches, and long-running processes
**Deployment Options:**
```bash theme={null}
# Local development
kubiya worker start --queue my-queue --type local
# Production daemon
kubiya worker start --queue prod-queue --mode daemon
# Docker container
kubiya worker start --queue prod-queue --type docker
# Kubernetes deployment (scalable)
kubiya worker install --queue prod-queue --replicas 3
```
**Key Benefits:**
* ✅ **Low Latency**: Workers are always ready to process tasks immediately
* ✅ **Run Anywhere**: Deploy on your own infrastructure (local, cloud, on-prem)
* ✅ **Custom Configuration**: Full control over resources, network, and dependencies
* ✅ **Connection Pooling**: Maintain persistent connections to databases and services
**Persistent Workers Require:**
* Infrastructure to run the worker process
* Ongoing resource costs (compute, memory, network)
* Monitoring and maintenance
* Network connectivity to Control Plane and Temporal
### Comparison
| Feature | Ephemeral Workers | Persistent Workers |
| ------------------ | -------------------------- | ---------------------------- |
| **Infrastructure** | Zero setup required | Requires deployment |
| **Lifecycle** | Single-task execution | Continuous operation |
| **Best For** | CI/CD, automation, testing | High-frequency, production |
| **Startup Time** | On-demand provision | Always ready |
| **Cost Model** | Pay per execution | Ongoing infrastructure costs |
| **Use Cases** | Pipelines, webhooks, cron | Monitoring, chatbots, APIs |
| **Deployment** | Automatic | Manual configuration |
| **Cleanup** | Automatic | Manual |
| **Network Access** | Kubiya Cloud or Local | Your infrastructure |
**Starting Point**: Use ephemeral workers for CI/CD and automation. Add persistent workers when you need lower latency, custom infrastructure, or high-frequency execution.
## Worker Architecture
### Core Components
```mermaid theme={null}
graph TB
subgraph "Worker Process"
WM[Worker Manager]
PE[Python Environment]
AC[Activity Controller]
EC[Event Client]
HC[Health Check]
end
subgraph "External Services"
CP[Control Plane]
TC[Temporal Cloud]
Tools[Tools & Integrations]
end
WM --> PE
WM --> AC
WM --> EC
WM --> HC
HC -->|Heartbeat| CP
AC -->|Poll Tasks| TC
EC -->|Stream Events| CP
PE -->|Execute| Tools
style WM fill:#4CAF50,color:#fff
style CP fill:#2196F3,color:#fff
style TC fill:#00BCD4,color:#fff
```
### Communication Flow
1. **Registration**: Worker registers with Control Plane and receives configuration
2. **Temporal Connection**: Connects to Temporal Cloud using provided credentials
3. **Task Polling**: Continuously polls assigned queue for new tasks
4. **Task Execution**: Executes agent workflows and activities
5. **Event Streaming**: Sends real-time events to Control Plane
6. **Health Reporting**: Periodic heartbeats with metrics and status
## Deployment Modes
### Local Mode
Best for development and testing.
```bash theme={null}
# Start local worker
kubiya worker start --queue-id=dev-queue --type=local
# With custom environment
export LOG_LEVEL=DEBUG
export HEARTBEAT_INTERVAL=15
kubiya worker start --queue-id=dev-queue --type=local
```
**Features:**
* Automatic Python virtual environment setup
* Foreground process with live logging
* Quick iteration and debugging
* Dependencies auto-installed
**Directory Structure:**
```
~/.kubiya/workers/dev-queue/
├── venv/ # Python virtual environment
├── logs/
│ └── worker.log # Execution logs
├── worker.py # Worker implementation
└── requirements.txt # Python dependencies
```
### Daemon Mode
Production deployment as a background process.
```bash theme={null}
# Start daemon
kubiya worker start --queue-id=prod-queue --type=local --daemon
# Or use shorthand
kubiya worker start --queue-id=prod-queue --type=local -d
# Check status
cat ~/.kubiya/workers/prod-queue/daemon_info.txt
# View logs
tail -f ~/.kubiya/workers/prod-queue/logs/worker.log
# Stop daemon
pkill -f "worker.py.*prod-queue"
```
**Features:**
* Runs in background
* Automatic restart on crash
* Log rotation (configurable)
* PID and status tracking
**Configuration:**
```bash theme={null}
# Start with custom log settings
kubiya worker start \
--queue-id=prod-queue \
--type=local \
--daemon \
--max-log-size=104857600 \ # 100MB
--max-log-backups=10
```
### Docker Mode
Isolated containerized deployment.
```bash theme={null}
# Start Docker worker via CLI
kubiya worker start --queue-id=docker-queue --type=docker
# Or run container directly
docker run -d \
--name kubiya-worker \
--restart unless-stopped \
-e KUBIYA_API_KEY="your-api-key" \
-e CONTROL_PLANE_URL="https://control-plane.kubiya.ai" \
-e QUEUE_ID="docker-queue" \
-e LOG_LEVEL="INFO" \
ghcr.io/kubiyabot/agent-worker:latest
# View logs
docker logs -f kubiya-worker
# Stop worker
docker stop kubiya-worker
docker rm kubiya-worker
```
**Docker Compose:**
```yaml theme={null}
# docker-compose.yml
version: '3.8'
services:
kubiya-worker:
image: ghcr.io/kubiyabot/agent-worker:latest
container_name: kubiya-worker
restart: unless-stopped
environment:
- KUBIYA_API_KEY=${KUBIYA_API_KEY}
- CONTROL_PLANE_URL=https://control-plane.kubiya.ai
- QUEUE_ID=docker-queue
- LOG_LEVEL=INFO
- HEARTBEAT_INTERVAL=30
volumes:
- ./logs:/root/.kubiya/workers/logs
logging:
driver: "json-file"
options:
max-size: "100m"
max-file: "10"
```
Start with:
```bash theme={null}
docker-compose up -d
docker-compose logs -f
```
### Kubernetes Mode
Scalable production deployment with high availability.
```yaml theme={null}
apiVersion: apps/v1
kind: Deployment
metadata:
name: kubiya-worker
namespace: kubiya
spec:
replicas: 3
selector:
matchLabels:
app: kubiya-worker
template:
metadata:
labels:
app: kubiya-worker
spec:
containers:
- name: worker
image: ghcr.io/kubiyabot/agent-worker:latest
command: ["kubiya", "worker", "start"]
args:
- "--queue-id=$(QUEUE_ID)"
- "--type=local"
env:
- name: KUBIYA_API_KEY
valueFrom:
secretKeyRef:
name: kubiya-secrets
key: api-key
- name: CONTROL_PLANE_URL
value: "https://control-plane.kubiya.ai"
- name: QUEUE_ID
value: "production-queue"
- name: LOG_LEVEL
value: "INFO"
- name: WORKER_HOSTNAME
valueFrom:
fieldRef:
fieldPath: metadata.name
resources:
requests:
memory: "512Mi"
cpu: "250m"
limits:
memory: "2Gi"
cpu: "1000m"
livenessProbe:
exec:
command: ["pgrep", "-f", "worker.py"]
initialDelaySeconds: 30
periodSeconds: 10
readinessProbe:
exec:
command: ["pgrep", "-f", "worker.py"]
initialDelaySeconds: 10
periodSeconds: 5
---
apiVersion: v1
kind: Secret
metadata:
name: kubiya-secrets
namespace: kubiya
type: Opaque
stringData:
api-key: "your-api-key-here"
```
```yaml theme={null}
apiVersion: autoscaling/v2
kind: HorizontalPodAutoscaler
metadata:
name: kubiya-worker-hpa
namespace: kubiya
spec:
scaleTargetRef:
apiVersion: apps/v1
kind: Deployment
name: kubiya-worker
minReplicas: 2
maxReplicas: 10
metrics:
- type: Resource
resource:
name: cpu
target:
type: Utilization
averageUtilization: 70
- type: Resource
resource:
name: memory
target:
type: Utilization
averageUtilization: 80
behavior:
scaleDown:
stabilizationWindowSeconds: 300
policies:
- type: Percent
value: 50
periodSeconds: 60
scaleUp:
stabilizationWindowSeconds: 60
policies:
- type: Percent
value: 100
periodSeconds: 30
- type: Pods
value: 2
periodSeconds: 30
selectPolicy: Max
```
```yaml theme={null}
apiVersion: v1
kind: ConfigMap
metadata:
name: kubiya-worker-config
namespace: kubiya
data:
LOG_LEVEL: "INFO"
HEARTBEAT_INTERVAL: "30"
METRICS_ENABLED: "true"
METRICS_PORT: "9090"
---
apiVersion: v1
kind: Service
metadata:
name: kubiya-worker-metrics
namespace: kubiya
labels:
app: kubiya-worker
spec:
ports:
- name: metrics
port: 9090
targetPort: 9090
selector:
app: kubiya-worker
---
apiVersion: monitoring.coreos.com/v1
kind: ServiceMonitor
metadata:
name: kubiya-worker
namespace: kubiya
spec:
selector:
matchLabels:
app: kubiya-worker
endpoints:
- port: metrics
interval: 30s
```
**Deploy:**
```bash theme={null}
# Create namespace
kubectl create namespace kubiya
# Apply manifests
kubectl apply -f kubiya-worker.yaml
# Scale deployment
kubectl scale deployment kubiya-worker -n kubiya --replicas=5
# View logs
kubectl logs -f deployment/kubiya-worker -n kubiya
# Check status
kubectl get pods -n kubiya
kubectl describe deployment kubiya-worker -n kubiya
```
## Configuration
### Environment Variables
API authentication key for Control Plane
Control Plane base URL
Override Control Plane URL (takes precedence)
Worker queue identifier (must match queue in Control Plane)
Environment name for the worker
Custom worker hostname for identification
Heartbeat interval in seconds (15-300)
Logging level: DEBUG, INFO, WARN, ERROR
Maximum concurrent activity executions
Maximum concurrent workflow executions
Explicit model ID to override agent/team configuration. All LLM requests will use this model regardless of agent settings.
### Advanced Configuration
```bash theme={null}
# Performance tuning
export MAX_CONCURRENT_ACTIVITIES=20
export MAX_CONCURRENT_WORKFLOWS=10
export ACTIVITY_TIMEOUT=600
# Custom control plane
export CONTROL_PLANE_GATEWAY_URL="https://cp.company.internal"
# Debug mode
export LOG_LEVEL=DEBUG
export KUBIYA_DEBUG=true
# Resource limits (Docker/K8s)
export MEMORY_LIMIT="2Gi"
export CPU_LIMIT="1000m"
# Start worker with configuration
kubiya worker start --queue-id=tuned-queue --type=local
```
## Monitoring
### Log Management
```bash theme={null}
# View real-time logs
tail -f ~/.kubiya/workers//logs/worker.log
# Search logs for errors
grep ERROR ~/.kubiya/workers//logs/worker.log
# View last 100 lines
tail -n 100 ~/.kubiya/workers//logs/worker.log
# Follow logs with filtering
tail -f ~/.kubiya/workers//logs/worker.log | grep "Task completed"
```
### Health Checks
```bash theme={null}
# Check if worker is running
ps aux | grep "worker.py.*"
# Check daemon status
cat ~/.kubiya/workers//daemon_info.txt
# Test connectivity to Control Plane
curl https://control-plane.kubiya.ai/health
# Verify Temporal connection (in worker logs)
grep "Connected to Temporal" ~/.kubiya/workers//logs/worker.log
```
### Metrics
Workers report the following metrics:
* **Task Execution**: Success/failure counts, execution time
* **Resource Usage**: CPU, memory, network
* **Queue Status**: Pending tasks, poll rate
* **Health Status**: Heartbeat success, connectivity
```bash theme={null}
# View metrics in logs
tail -f ~/.kubiya/workers//logs/worker.log | grep "metrics"
# Example output:
# [INFO] Metrics: tasks_completed=42, avg_duration=3.2s, memory_mb=512
```
## Troubleshooting
### Worker Won't Start
```bash theme={null}
# Check Python version (requires 3.8+)
python3 --version
# Clear virtual environment
rm -rf ~/.kubiya/workers//venv
# Start with debug logging
export LOG_LEVEL=DEBUG
kubiya worker start --queue-id= --type=local
# Check for port conflicts
lsof -i :7233 # Temporal port
```
### Connection Issues
```bash theme={null}
# Test Control Plane connectivity
curl -v https://control-plane.kubiya.ai/health
# Check API key
echo $KUBIYA_API_KEY
# Verify DNS resolution
nslookup control-plane.kubiya.ai
# Check firewall/proxy settings
echo $HTTP_PROXY
echo $HTTPS_PROXY
```
### Worker Crashes
```bash theme={null}
# Check crash logs
tail -n 500 ~/.kubiya/workers//logs/worker.log | grep ERROR
# Increase memory limits (Docker/K8s)
# Edit deployment and set higher resource limits
# Enable auto-restart (daemon mode)
kubiya worker start --queue-id= --type=local --daemon
# Check for dependency issues
~/.kubiya/workers//venv/bin/pip list
```
### Task Execution Failures
```bash theme={null}
# Check activity timeouts
export ACTIVITY_TIMEOUT=1200 # Increase to 20 minutes
# Verify skill availability
kubiya skill list
# Check agent configuration
kubiya agent get
# Review execution logs
tail -f ~/.kubiya/workers//logs/worker.log | grep "Activity failed"
```
## Best Practices
### Production Deployment
**Use Daemon or Kubernetes Mode**: Never run production workers in foreground
**Monitor Health**: Set up alerting for heartbeat failures
**Resource Limits**: Configure appropriate CPU/memory limits
**Log Rotation**: Enable log rotation to prevent disk fill
**Multiple Replicas**: Run at least 2-3 workers for high availability
### Security
* ✅ **Store API keys in secrets** (Kubernetes Secrets, AWS Secrets Manager)
* ✅ **Rotate keys regularly** (at least quarterly)
* ✅ **Use network policies** to restrict traffic
* ✅ **Enable TLS** for all communications
* ✅ **Monitor access logs** for suspicious activity
### Performance Optimization
```bash theme={null}
# Tune concurrency based on workload
export MAX_CONCURRENT_ACTIVITIES=50 # For high-throughput
export MAX_CONCURRENT_WORKFLOWS=20
# Adjust heartbeat interval
export HEARTBEAT_INTERVAL=15 # More frequent for critical workers
# Optimize Python environment
# Use pypy for better performance
~/.kubiya/workers//venv/bin/pip install pypy
```
### Scaling Strategy
```yaml theme={null}
# Increase resources per worker
resources:
requests:
memory: "2Gi"
cpu: "1000m"
limits:
memory: "4Gi"
cpu: "2000m"
```
```bash theme={null}
# Increase replica count
kubectl scale deployment kubiya-worker -n kubiya --replicas=10
# Or use HPA for auto-scaling
kubectl apply -f hpa.yaml
```
```bash theme={null}
# Separate workers for different workloads
kubiya worker start --queue-id=high-priority-queue --type=local &
kubiya worker start --queue-id=low-priority-queue --type=local &
kubiya worker start --queue-id=batch-queue --type=local &
```
## Custom LLM Gateway
Workers normally use the Control Plane's LLM gateway. You can override this to route requests through your own providers (AWS Bedrock, Azure OpenAI, Ollama, etc.) for cost control, observability, or network isolation.
**Quick example:**
```bash theme={null}
kubiya worker start \
--queue-id=my-queue \
--type=local \
--enable-local-proxy \
--proxy-config-file=./litellm_config.yaml
```
**Example config for AWS Bedrock:**
```yaml theme={null}
model_list:
- model_name: claude-3-5-sonnet
litellm_params:
model: bedrock/anthropic.claude-3-5-sonnet-20240620-v1:0
aws_access_key_id: os.environ/AWS_ACCESS_KEY_ID
aws_secret_access_key: os.environ/AWS_SECRET_ACCESS_KEY
aws_region_name: us-east-1
```
**See [Custom LLM Gateway](/cli/custom-llm-gateway)** for complete documentation with all providers, configuration methods, and troubleshooting.
## Worker Pool Web Interface
When you start a worker, it automatically launches a built-in web interface for monitoring, debugging, and testing executions in real-time.
### Accessing the WebUI
The WebUI is available at `http://127.0.0.1:8088` by default when starting a worker:
```bash theme={null}
kubiya worker start --queue-id=my-queue --type=local
```
To use a custom port:
```bash theme={null}
kubiya worker start --queue-id=my-queue --type=local --webui-port=9000
```
The WebUI provides real-time Server-Sent Events (SSE) streaming for live updates on worker status, executions, and logs.
### Overview Dashboard
The Overview page displays real-time worker metrics, control plane connection status, and recent activity.
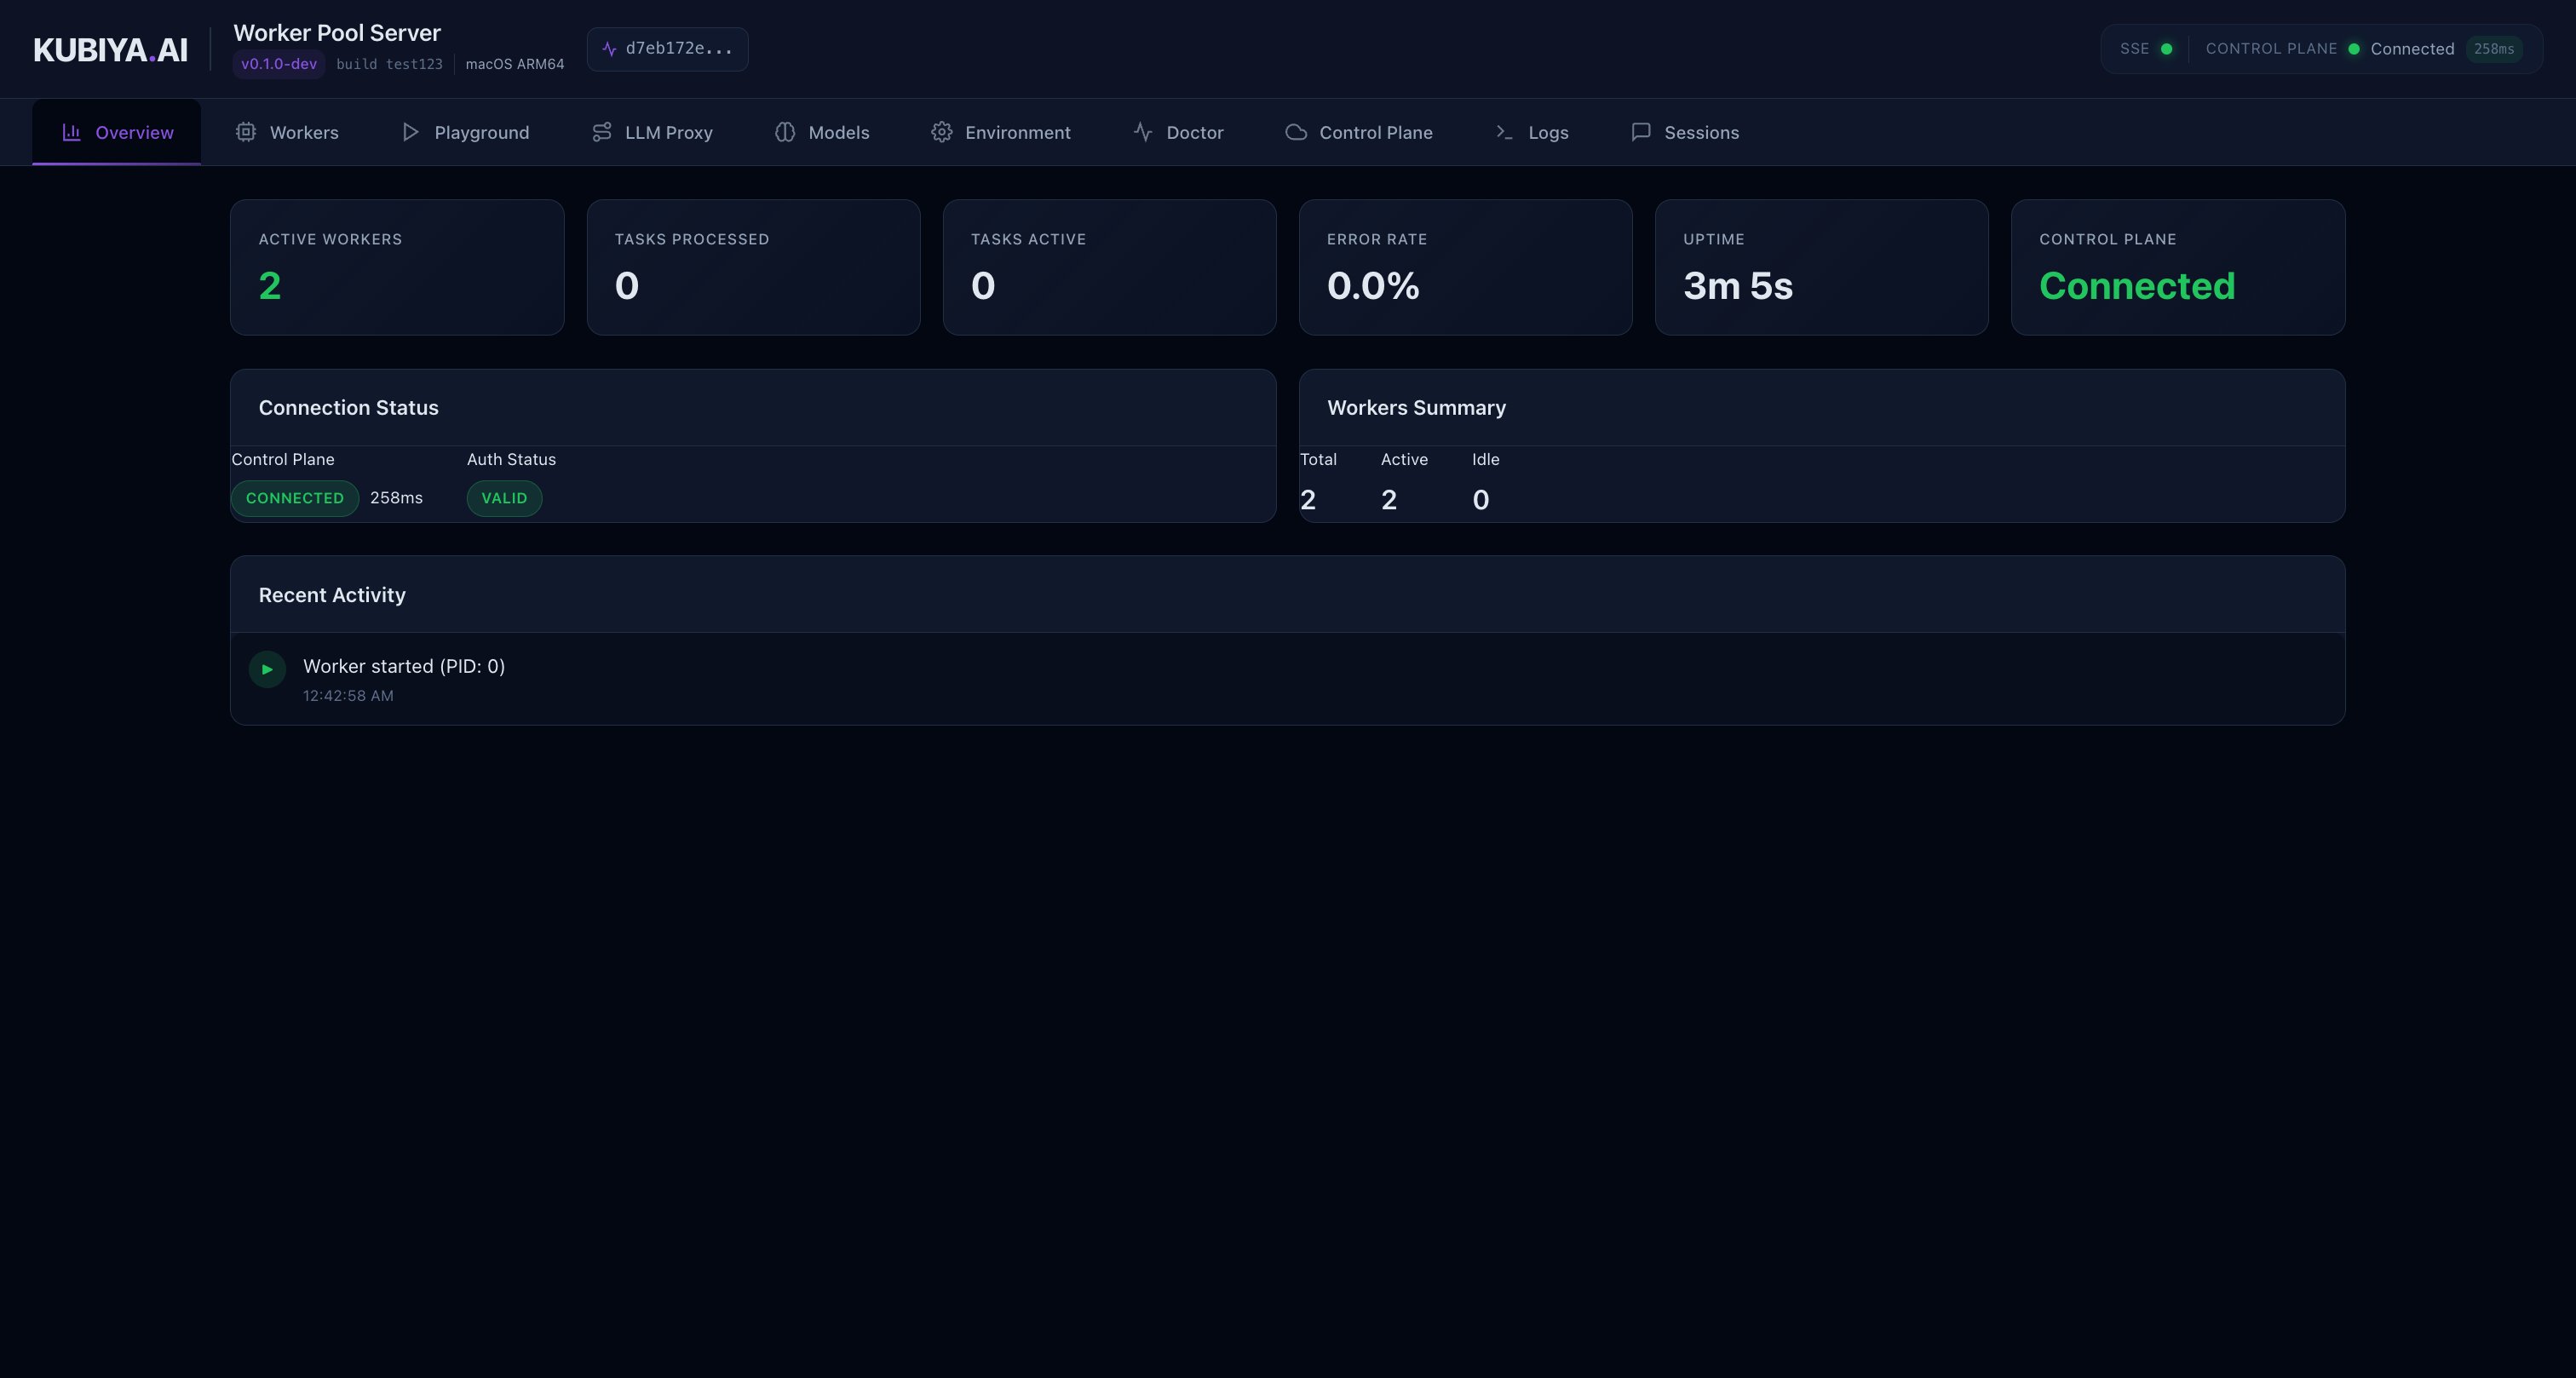 Key features:
* **Worker Status**: Active workers, their PIDs, and uptime
* **Control Plane Connection**: Real-time connection status with latency
* **Recent Activity**: Latest executions and events
* **System Information**: Version, build, and OS details
### Workers List
Monitor all active workers in your pool with detailed status information.
Key features:
* **Worker Status**: Active workers, their PIDs, and uptime
* **Control Plane Connection**: Real-time connection status with latency
* **Recent Activity**: Latest executions and events
* **System Information**: Version, build, and OS details
### Workers List
Monitor all active workers in your pool with detailed status information.
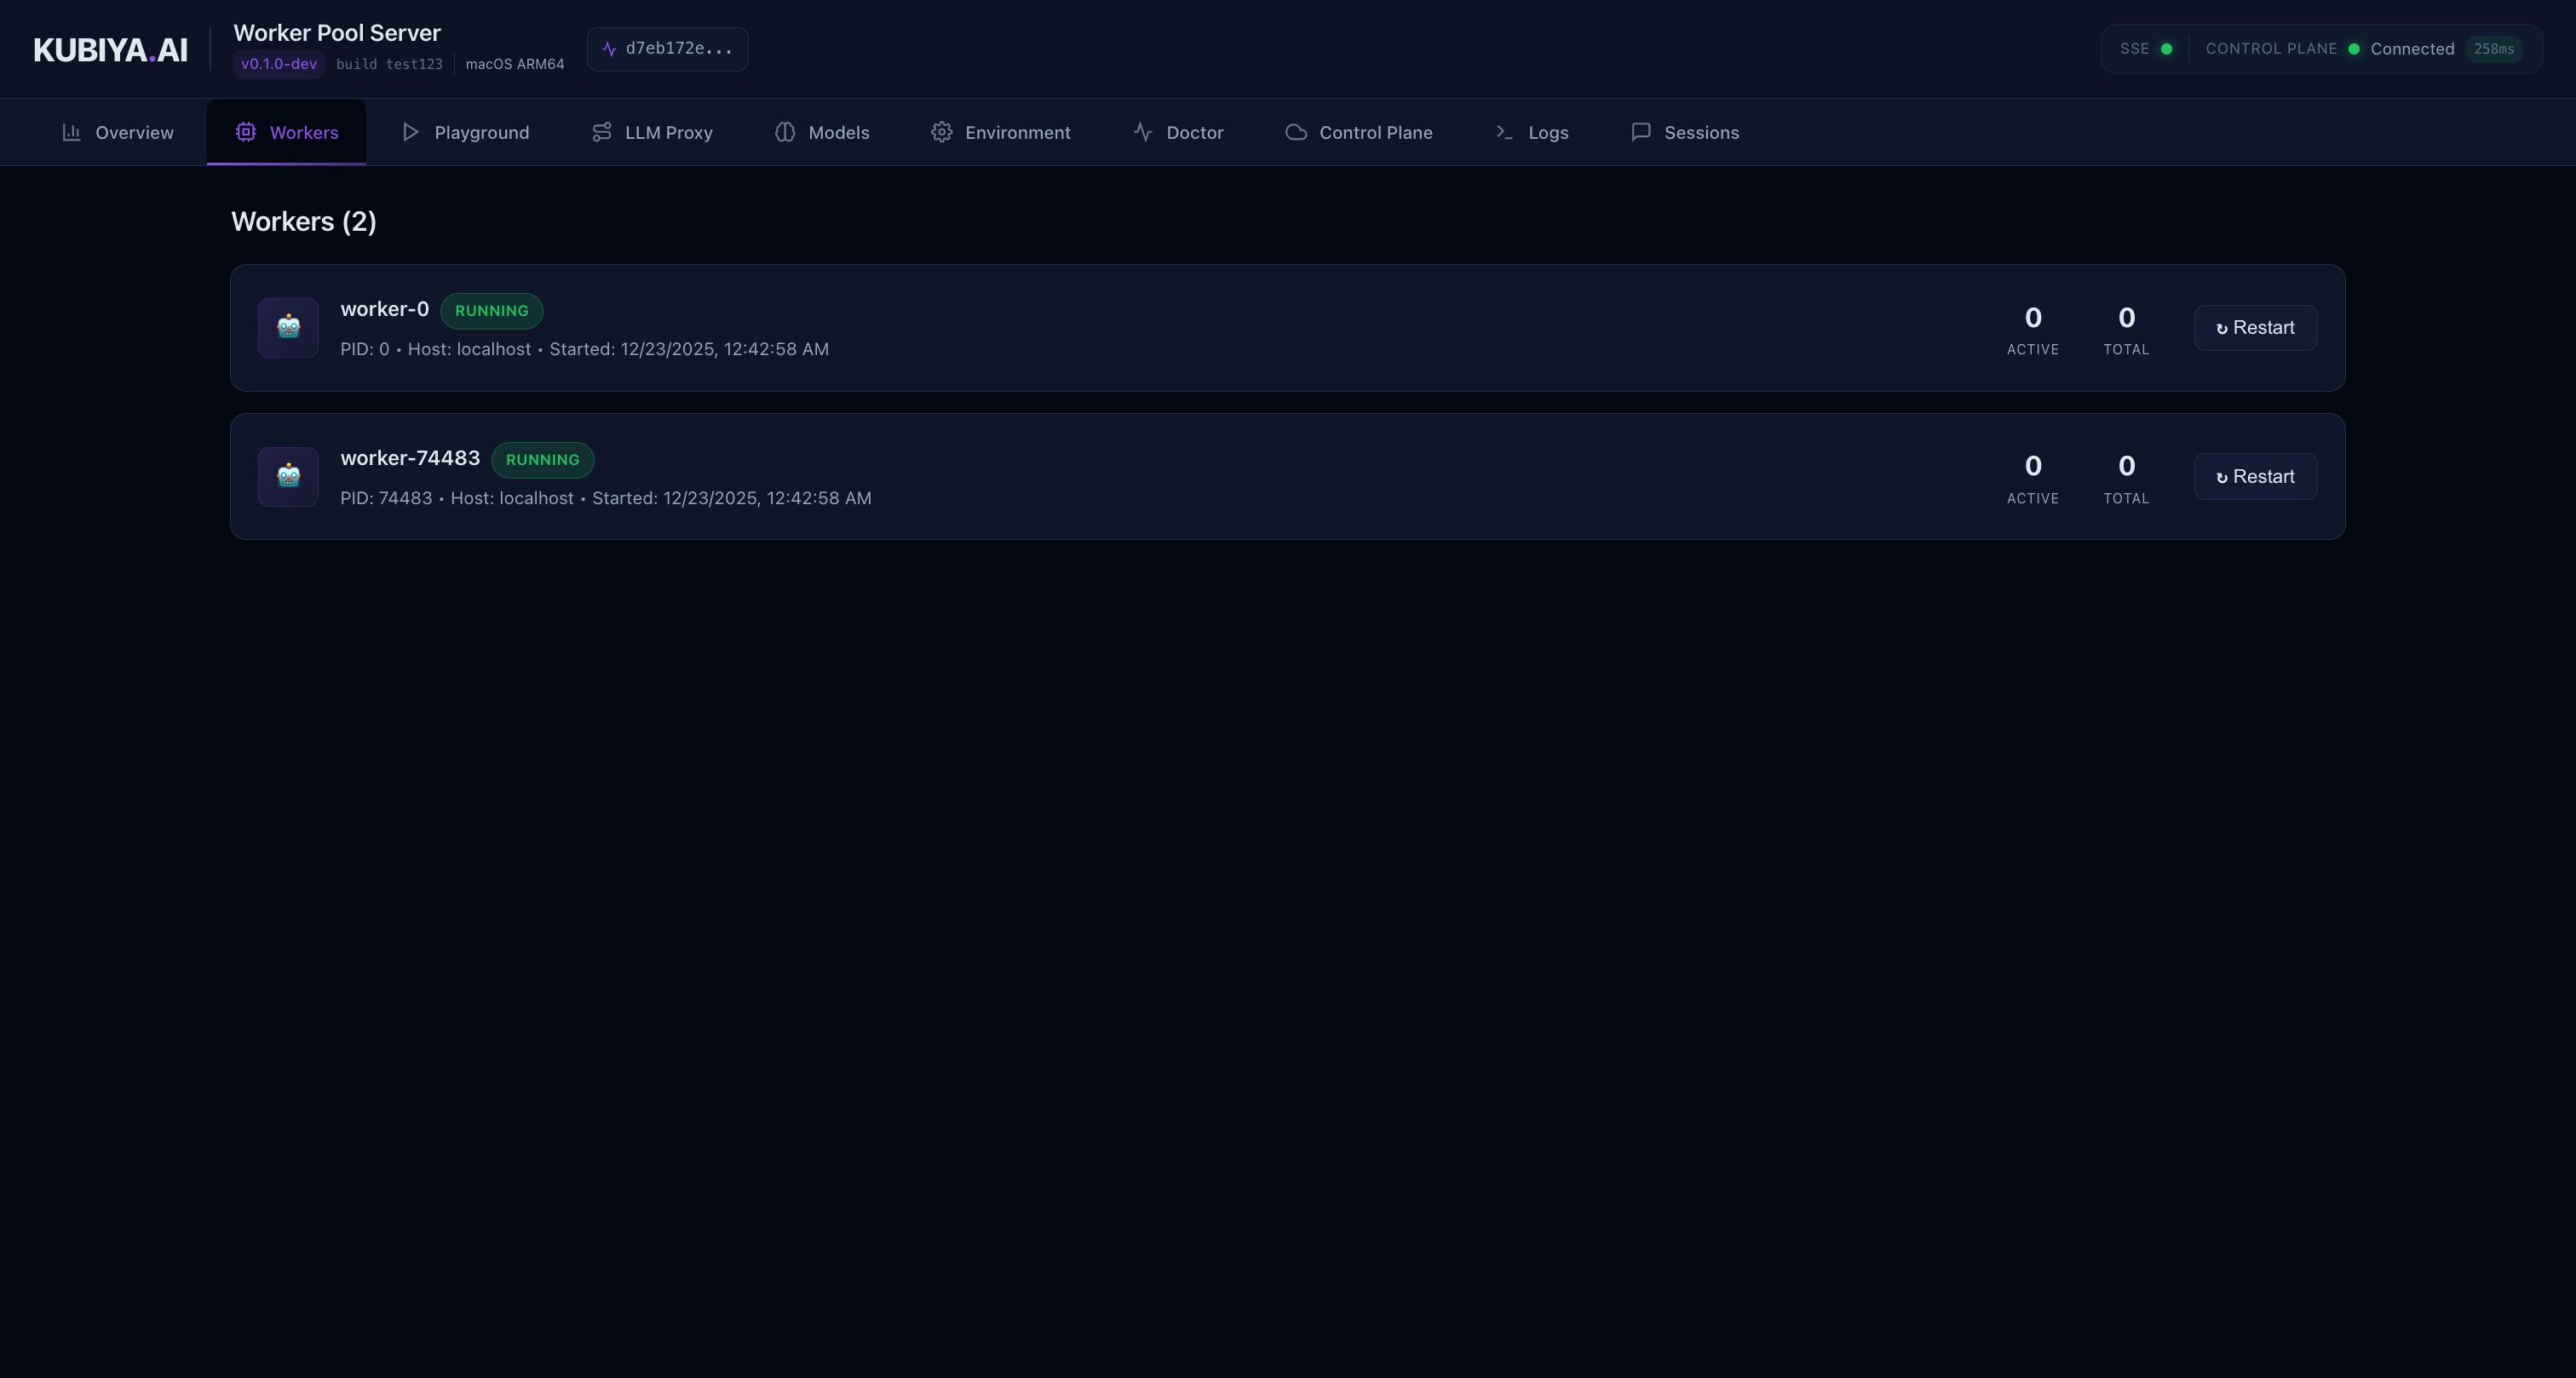 The workers view shows:
* Worker ID and hostname
* Process ID (PID)
* Current status and uptime
* Task queue assignment
### Execution Playground
The Playground provides an interactive interface to test agent executions with real-time streaming output.
The workers view shows:
* Worker ID and hostname
* Process ID (PID)
* Current status and uptime
* Task queue assignment
### Execution Playground
The Playground provides an interactive interface to test agent executions with real-time streaming output.
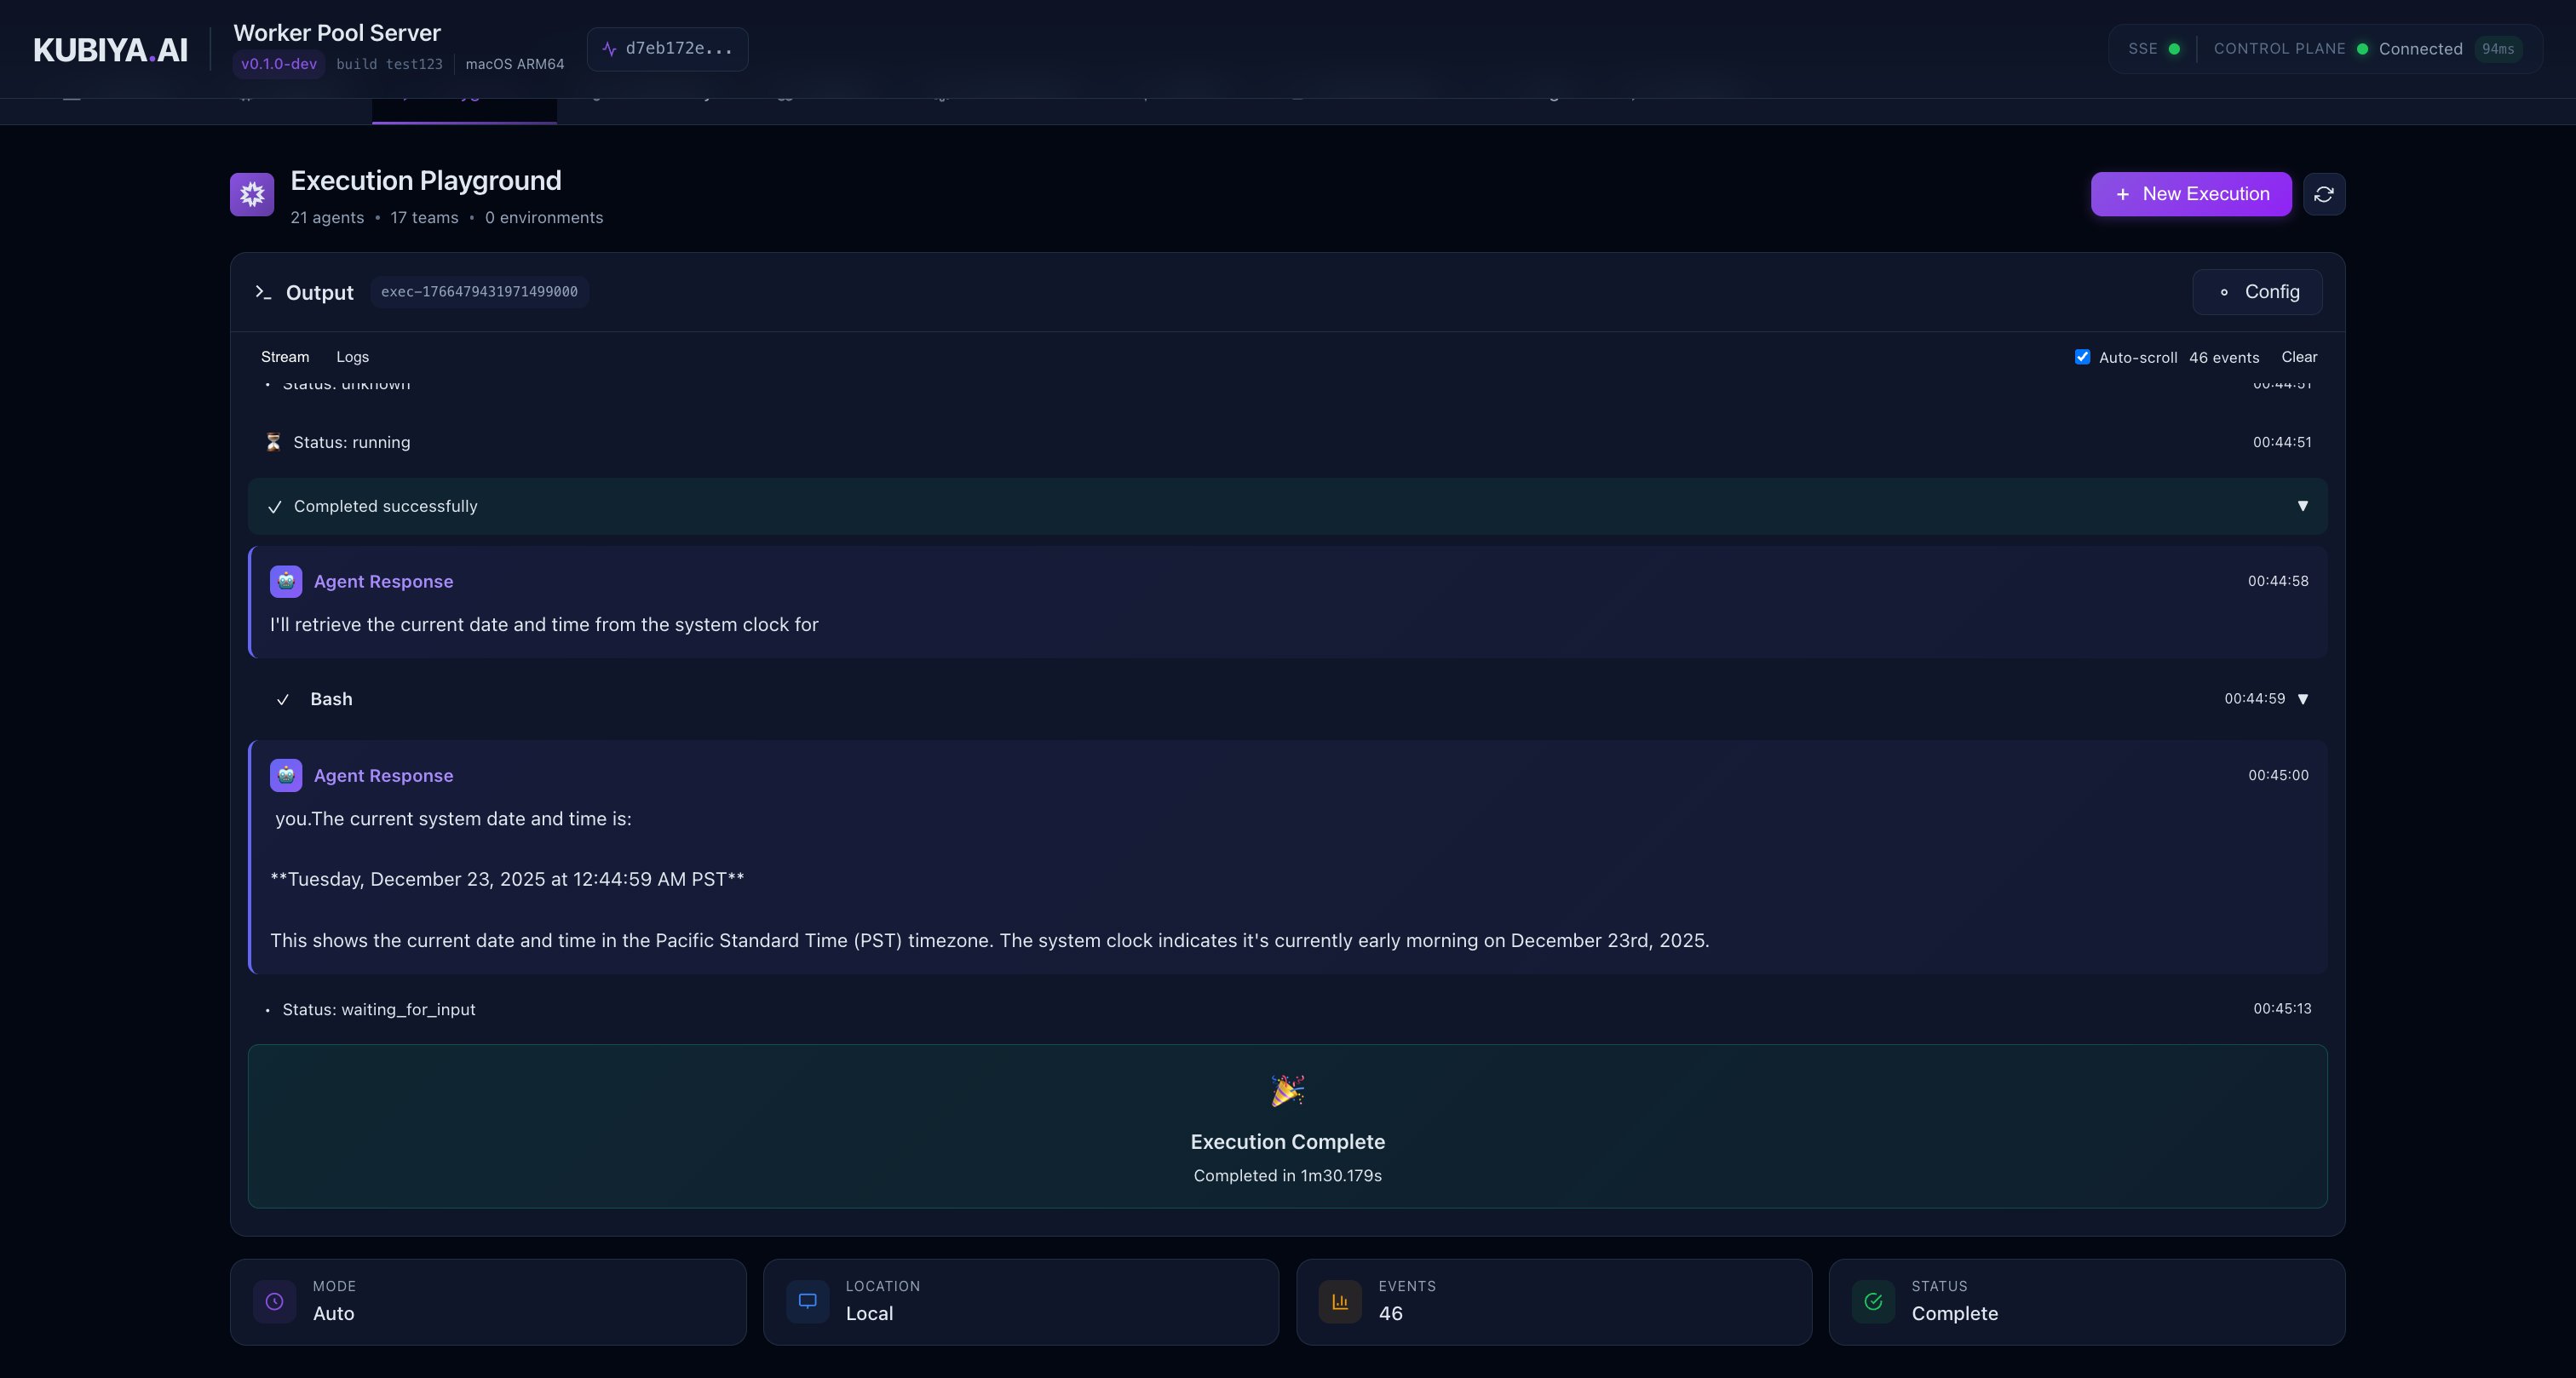 Features:
* **Agent Selection**: Choose from available agents
* **Working Directory**: Set the execution context
* **Real-time Streaming**: Watch agent reasoning, tool calls, and outputs live
* **Tool Call Visualization**: Collapsible cards showing tool inputs and outputs
Features:
* **Agent Selection**: Choose from available agents
* **Working Directory**: Set the execution context
* **Real-time Streaming**: Watch agent reasoning, tool calls, and outputs live
* **Tool Call Visualization**: Collapsible cards showing tool inputs and outputs
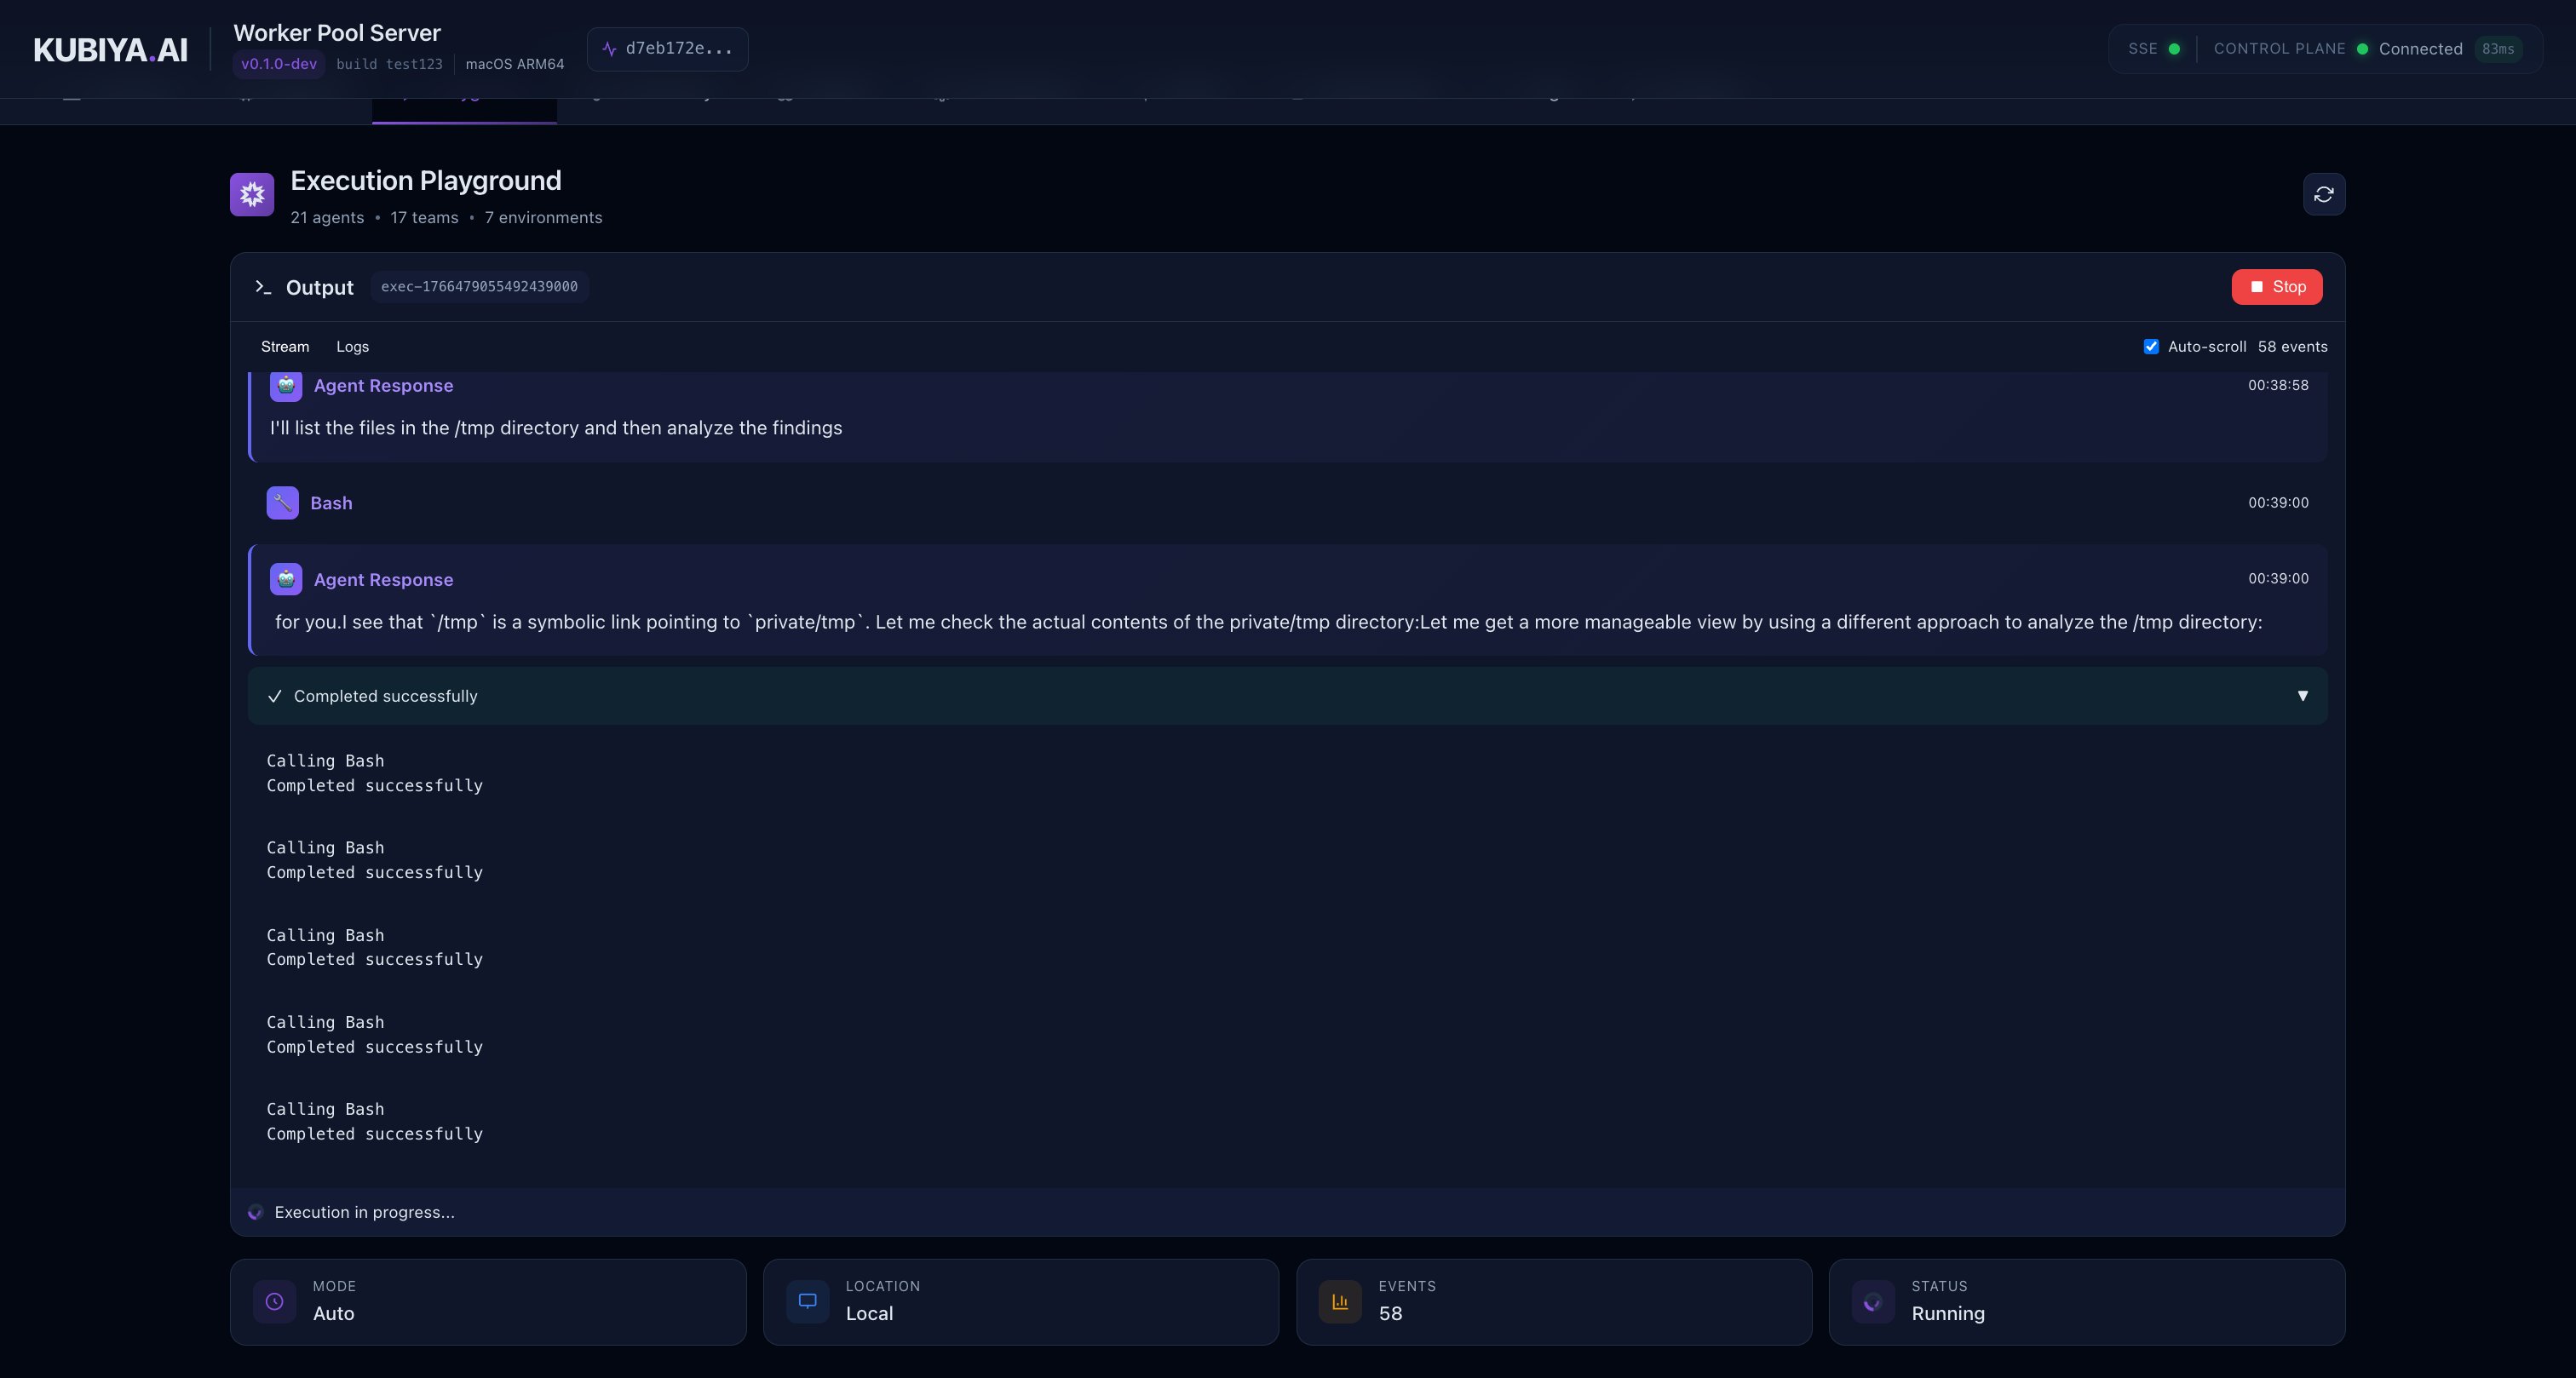 During execution, you can see:
* Agent's reasoning process
* Tool calls with expandable input/output details
* Real-time output as the agent works
* Execution status and duration
### LLM Proxy Control
Manage your local LiteLLM proxy settings when using `--enable-local-proxy`.
During execution, you can see:
* Agent's reasoning process
* Tool calls with expandable input/output details
* Real-time output as the agent works
* Execution status and duration
### LLM Proxy Control
Manage your local LiteLLM proxy settings when using `--enable-local-proxy`.
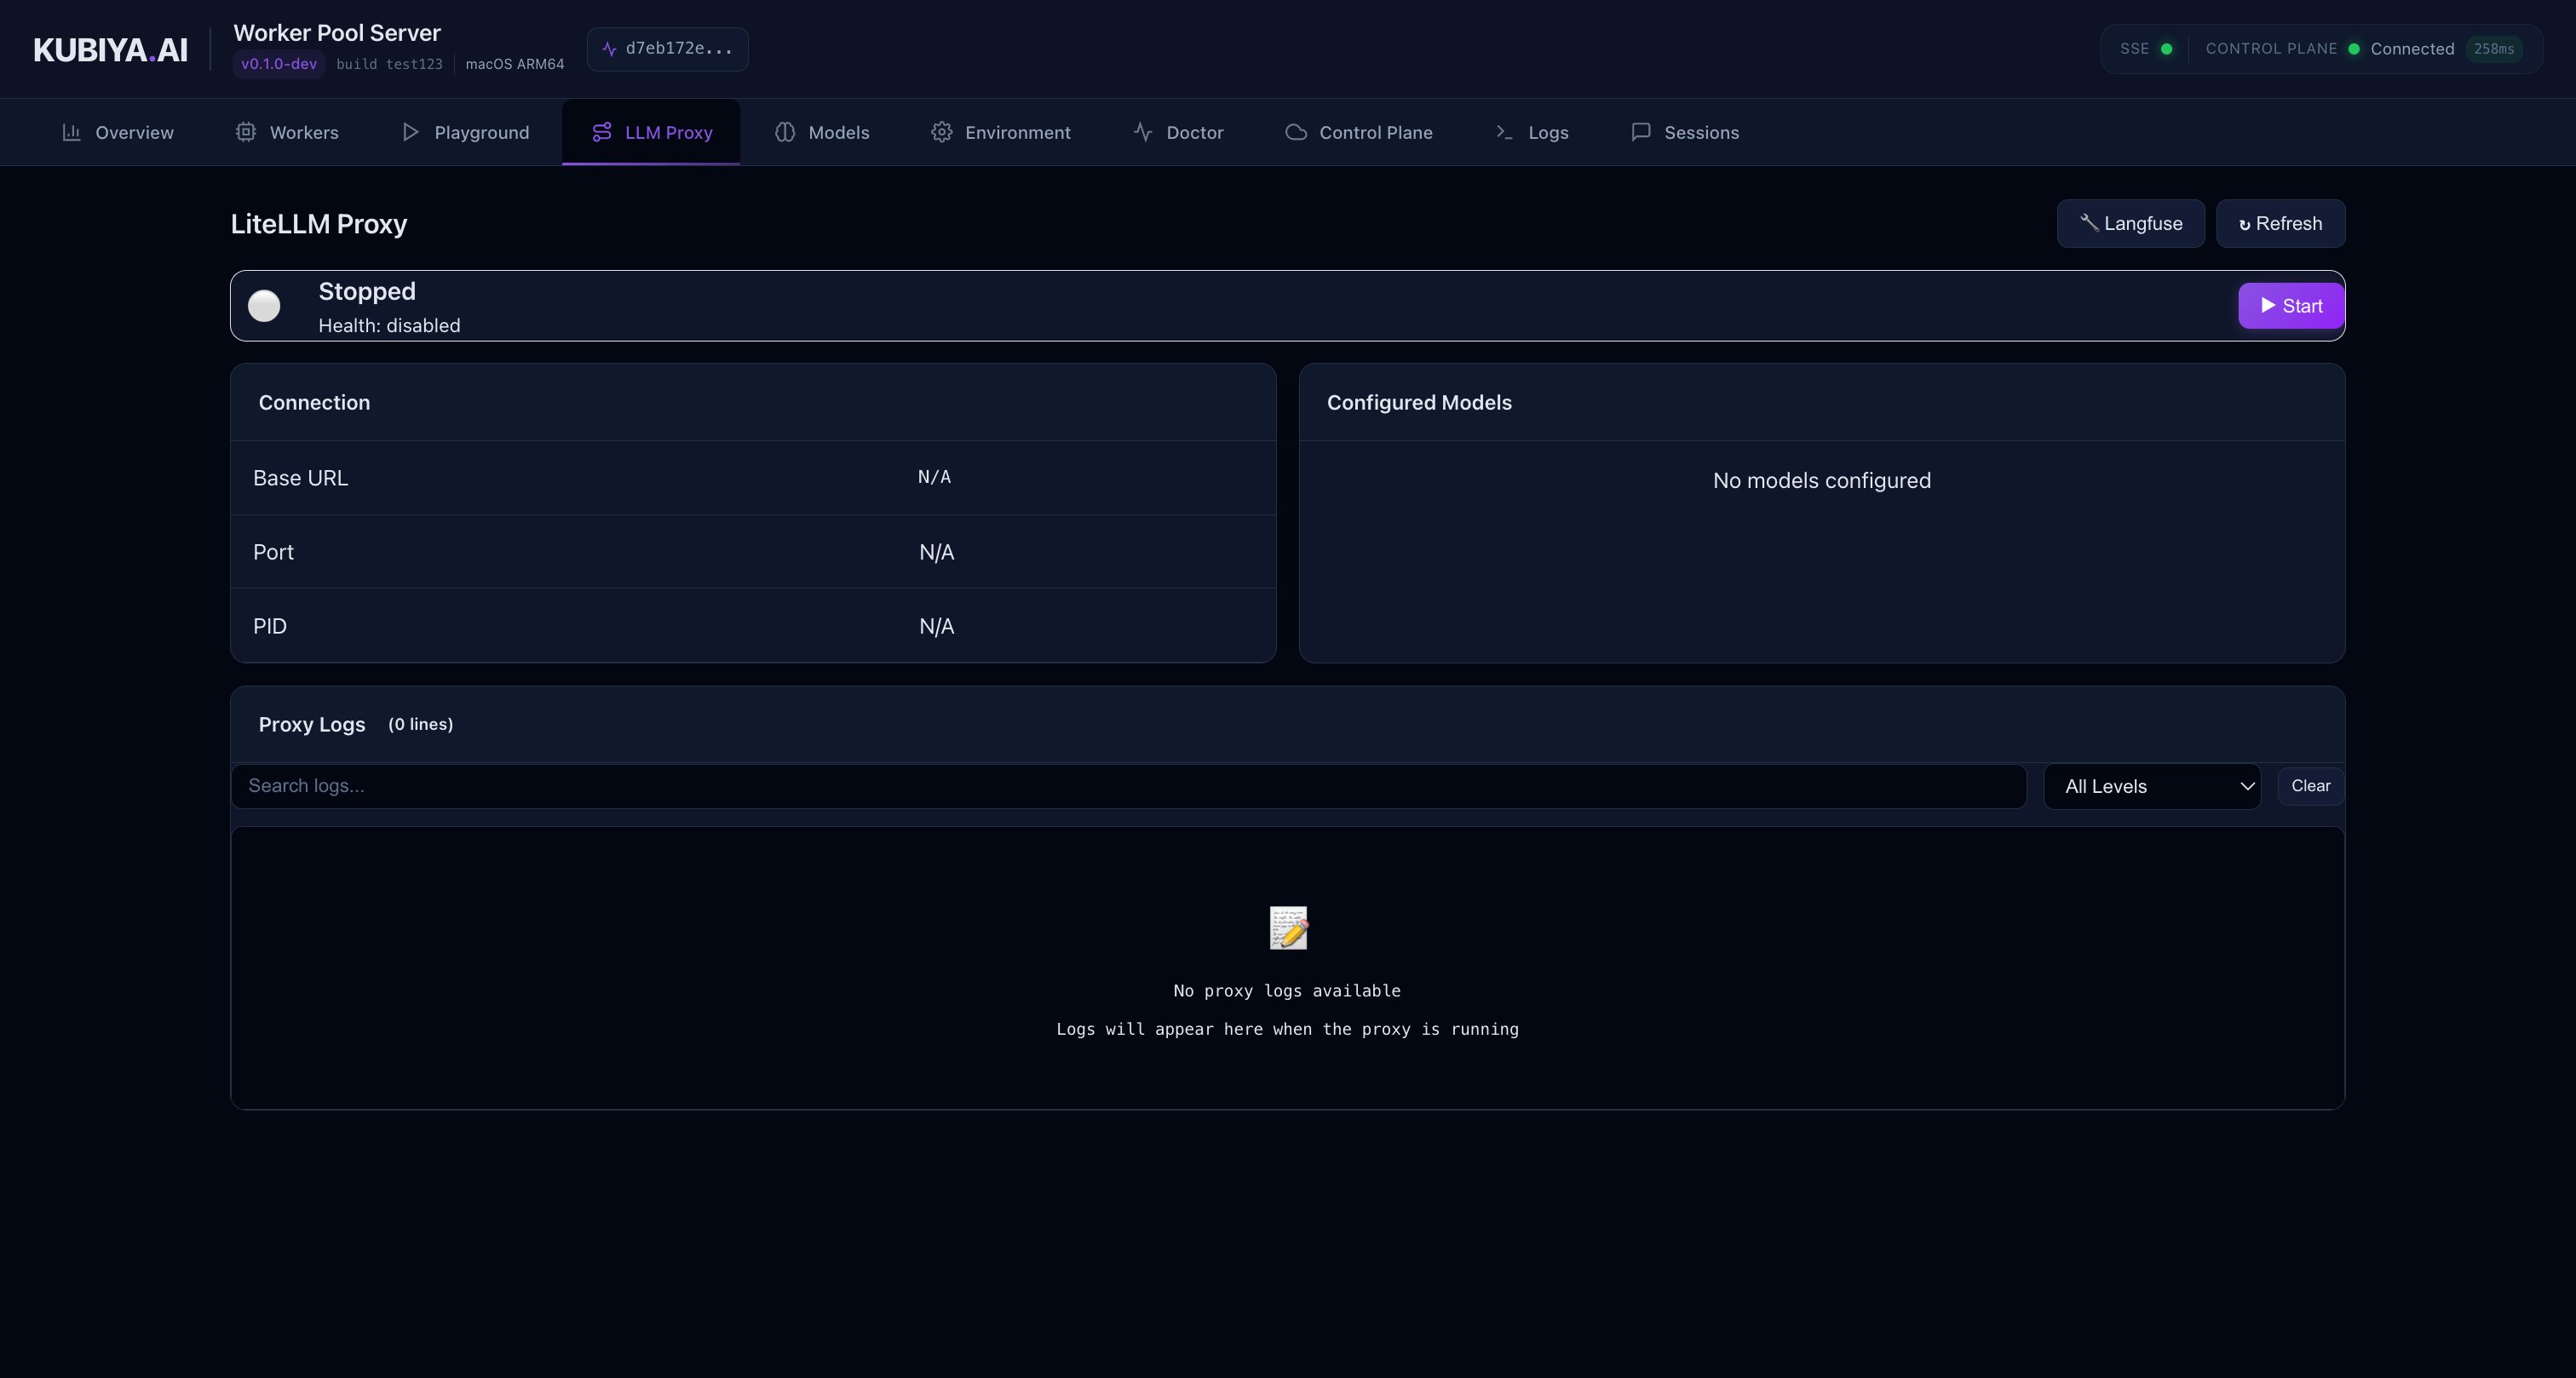 The proxy panel allows you to:
* View proxy status and health
* Monitor request routing
* Check configured model endpoints
### Models
Browse and test available LLM models through your configured providers.
The proxy panel allows you to:
* View proxy status and health
* Monitor request routing
* Check configured model endpoints
### Models
Browse and test available LLM models through your configured providers.
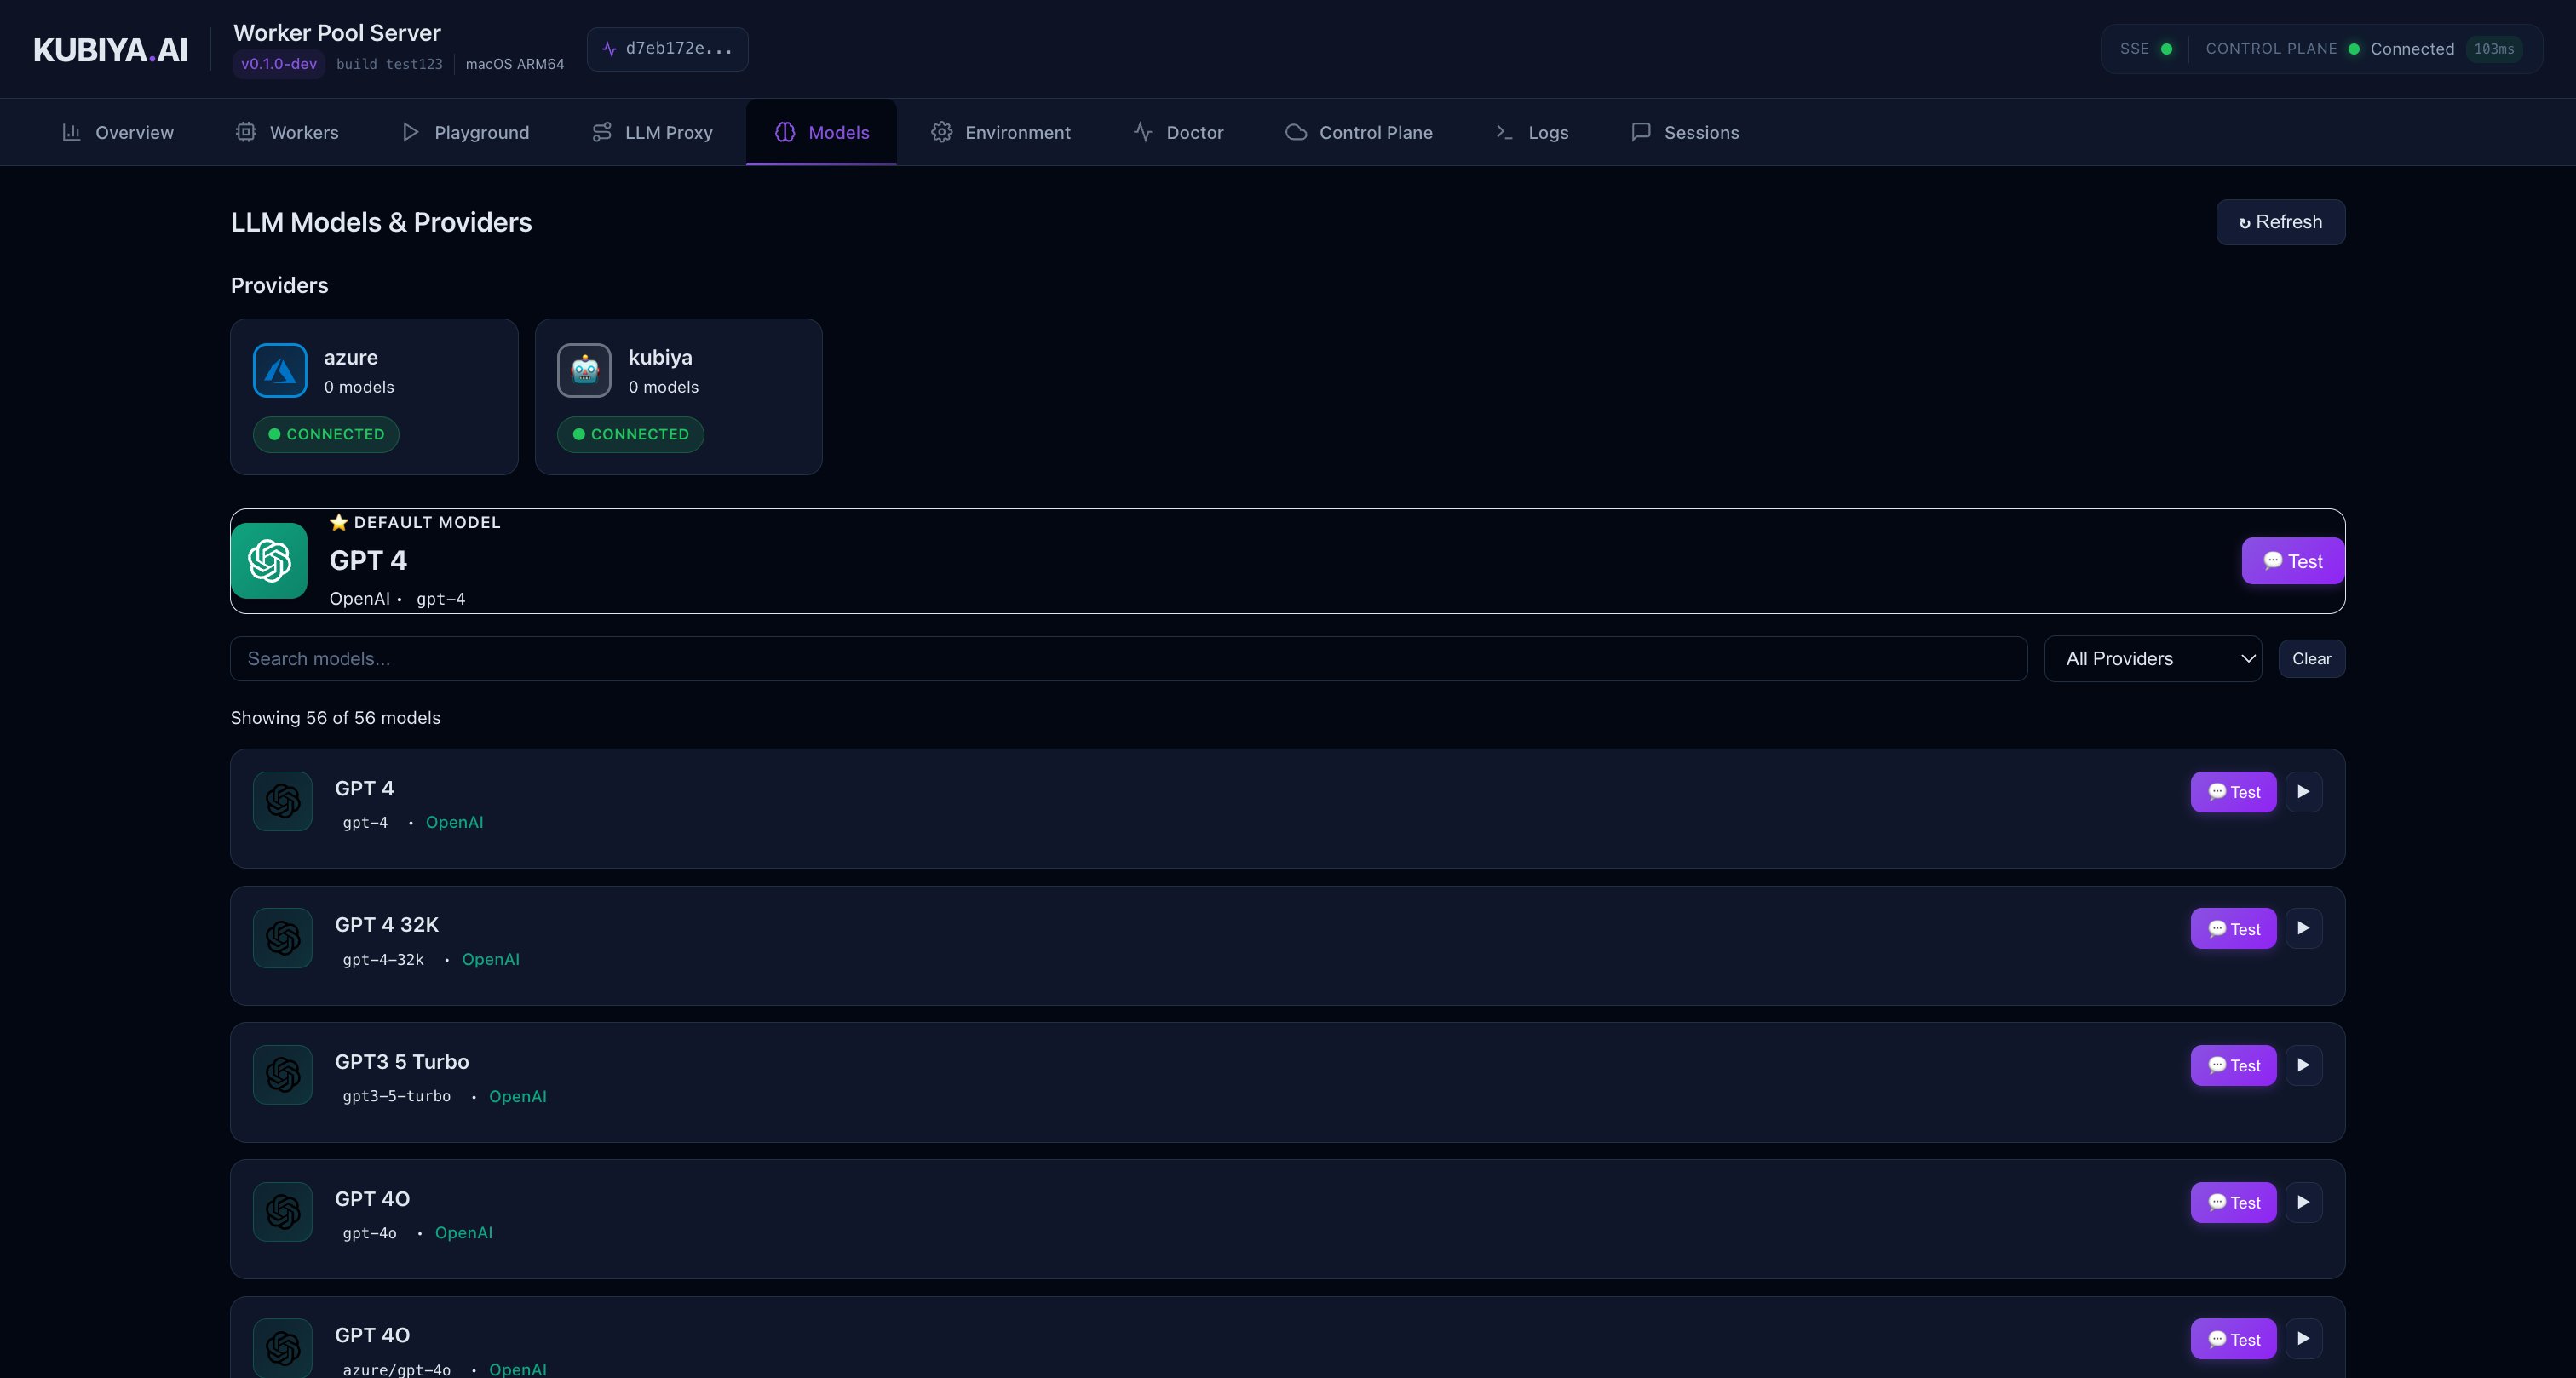 The models view displays:
* Available model providers (OpenAI, Anthropic, Bedrock, etc.)
* Model capabilities and pricing tiers
* Quick access to test models in the Playground
### Additional Pages
The WebUI includes several other useful pages:
* **Environment**: View and manage environment variables
* **Doctor**: Diagnostic checks for common configuration issues
* **Control Plane**: Detailed control plane connection information
* **Logs**: Real-time log streaming and historical log search
* **Sessions**: View active and past execution sessions
## Command Reference
### Worker Start Command
The `kubiya worker start` command supports the following flags:
#### Required Flags
Worker queue identifier that matches a queue configured in the Control Plane
Worker deployment type: `local` or `docker`
#### Optional Flags
Run worker as background daemon process (shorthand: `-d`)
Maximum log file size in bytes before rotation (daemon mode only)
Number of rotated log files to keep (daemon mode only)
#### WebUI Flags
Port for the built-in web interface. The WebUI provides real-time monitoring, execution playground, and diagnostics.
#### Local LiteLLM Proxy Flags
Enable local LiteLLM proxy gateway alongside the worker. When enabled, the worker will route all LLM requests through a local proxy instead of the Control Plane gateway.
Path to LiteLLM proxy configuration file (JSON or YAML). Requires `--enable-local-proxy`.
Inline LiteLLM proxy configuration as JSON string. Requires `--enable-local-proxy`.
#### Model Override Flag
Explicit model ID to override agent/team configuration. When set, all LLM requests will use this model regardless of agent settings. Useful for testing, cost control, or debugging. Can also be set via `KUBIYA_MODEL` environment variable.
### Other Worker Commands
```bash theme={null}
# Stop worker (daemon mode)
kubiya worker stop --queue-id=
# View worker status
kubiya worker status --queue-id=
# List all workers
kubiya worker list
# View logs
kubiya worker logs --queue-id=
# Clear worker data
kubiya worker clean --queue-id=
```
## Next Steps
Manage executions and schedule jobs with workers
Execute tasks with automatic planning
Manage agents and teams
Deploy operators and manage environments
The models view displays:
* Available model providers (OpenAI, Anthropic, Bedrock, etc.)
* Model capabilities and pricing tiers
* Quick access to test models in the Playground
### Additional Pages
The WebUI includes several other useful pages:
* **Environment**: View and manage environment variables
* **Doctor**: Diagnostic checks for common configuration issues
* **Control Plane**: Detailed control plane connection information
* **Logs**: Real-time log streaming and historical log search
* **Sessions**: View active and past execution sessions
## Command Reference
### Worker Start Command
The `kubiya worker start` command supports the following flags:
#### Required Flags
Worker queue identifier that matches a queue configured in the Control Plane
Worker deployment type: `local` or `docker`
#### Optional Flags
Run worker as background daemon process (shorthand: `-d`)
Maximum log file size in bytes before rotation (daemon mode only)
Number of rotated log files to keep (daemon mode only)
#### WebUI Flags
Port for the built-in web interface. The WebUI provides real-time monitoring, execution playground, and diagnostics.
#### Local LiteLLM Proxy Flags
Enable local LiteLLM proxy gateway alongside the worker. When enabled, the worker will route all LLM requests through a local proxy instead of the Control Plane gateway.
Path to LiteLLM proxy configuration file (JSON or YAML). Requires `--enable-local-proxy`.
Inline LiteLLM proxy configuration as JSON string. Requires `--enable-local-proxy`.
#### Model Override Flag
Explicit model ID to override agent/team configuration. When set, all LLM requests will use this model regardless of agent settings. Useful for testing, cost control, or debugging. Can also be set via `KUBIYA_MODEL` environment variable.
### Other Worker Commands
```bash theme={null}
# Stop worker (daemon mode)
kubiya worker stop --queue-id=
# View worker status
kubiya worker status --queue-id=
# List all workers
kubiya worker list
# View logs
kubiya worker logs --queue-id=
# Clear worker data
kubiya worker clean --queue-id=
```
## Next Steps
Manage executions and schedule jobs with workers
Execute tasks with automatic planning
Manage agents and teams
Deploy operators and manage environments